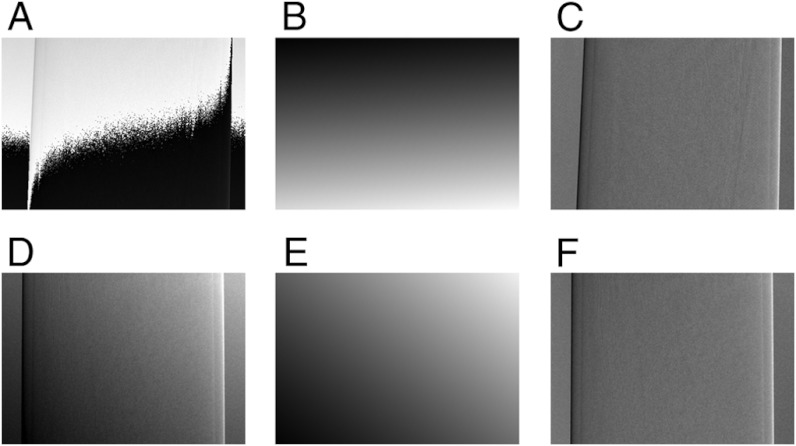
Fig. 3.
Adaptive differential phase recovery (ADPR). In order to be able to appreciate the magnitude of the phase ramp, the shown images are displayed on a linear gray scale with the windowing range indicated in square brackets. Signal saturation in these differential phase projections corresponds to image values of ± π. (A) Uncorrected differential phase projection with a strongly pronounced differential phase ramp, which causes differential phase wrapping [-π,π]. (B) Subtracted differential phase plane [-1.45,0]. (C) ADPR-corrected differential phase projection using the described adaptive differential phase recovery method [-1.1,1.1]. (D) Uncorrected differential phase projection with a moderate differential phase ramp [-0.8,1.65]. (E) Subtracted differential phase plane [-1,0.8]. (F) ADPR-corrected differential phase projection [-1.1,1.1].

