Fig. 2.
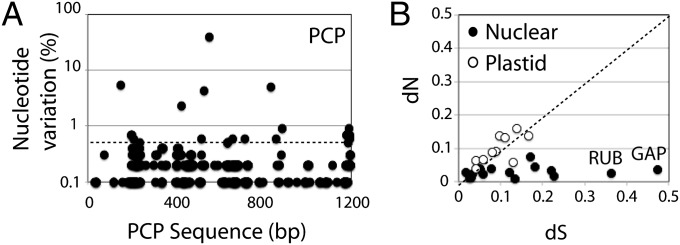
Sequence variation among transcripts. (A) The nucleotide variation (% total reads with a nucleotide different from a Peridinin-Chlorophyll a-Protein (PCP) reference sequence at each position) is given along the PCP sequence. The dotted horizontal line at 0.5% variation is the threshold used for calculating dS and dN. (B) The ratio of nonsynonymous (dN) to synonymous (dS) changes is shown for NCBI reference sequences with greater than 1000-fold coverage. The dotted line (dN/dS = 1) represents neutral selection. Plastid-encoded (○) and nuclear-encoded (●) sequences are shown separately. The positions of RuBisCo (RUB) and glyceraldehyde-3-phosphate dehydrogenase (GAP) are indicated.

