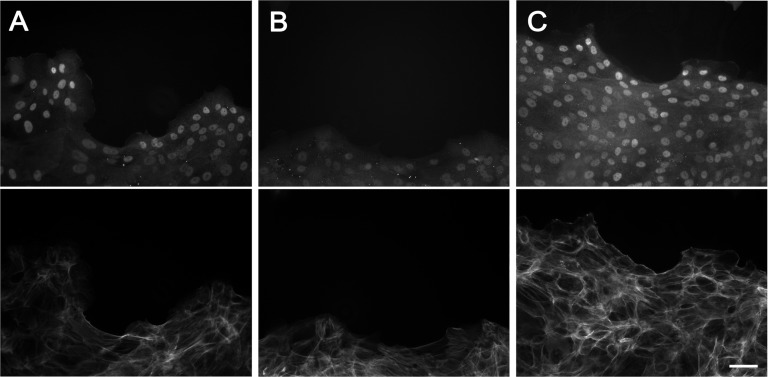
Fig. 5.
EGFR signaling is selectively activated at convex and straight edges. Moving edges of sheets of HCLE cells after no treatment (A), 4 h with 0.25 μM tyrphostin AG 1478 (B), or 1 h with 10 nM EGF (C). Upper images show staining with an anti–c-fos antibody, and the exposures are directly comparable. Lower images show staining with labeled phalloidin. (Scale bar: 100 μm.)

