
Table 1.
Analysis of main contributions to the standard rate constant for several Ni-N distances
| R(Å) * | μ/ν † | Pμ ‡ |
 §
§
|
 ¶
¶
|
% contrib.∥ |
| 2.94 | 1/0 | 2.7 × 10⁻³ | 0.065 | 5.3 × 10⁻⁴ | 30 |
| 2/0 | 2.1 × 10⁻⁴ | 0.587 | 1.5 × 10⁻³ | 61 | |
| 3.04 | 2/0 | 3.8 × 10⁻⁶ | 0.215 | 6.8 × 10⁻³ | 42 |
| 3/0 | 1.3 × 10⁻⁶ | 0.571 | 9.8 × 10⁻³ | 55 | |
| 3.25 | 0/3 | 1.0 | 0.855 | 5.1 × 10⁻¹² | 40 |
| 4/0 | 4.3 × 10⁻¹¹ | 0.917 | 1.6 × 10⁻¹ | 58 |
*The Ni-N distance of 2.94 Å is the shortest distance examined. The intermediate Ni-N distance of 3.04 Å is 0.04 Å larger than the dominant distance, and the Ni-N distance of 3.25 Å is the average equilibrium distance.
†μ and ν correspond to the proton vibrational states for the reduced and oxidized states, respectively, of the catalyst.
‡Pμ is the Boltzmann probability for state μ.
§Sμν is the overlap integral between the proton vibrational wavefunctions associated with states μ and ν.
¶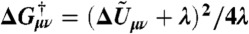 and is the effective free energy barrier at η = ε = 0.
∥% contrib. is the percentage contribution to the overall standard rate constant at that distance R,  , including only contributions greater than 10%.