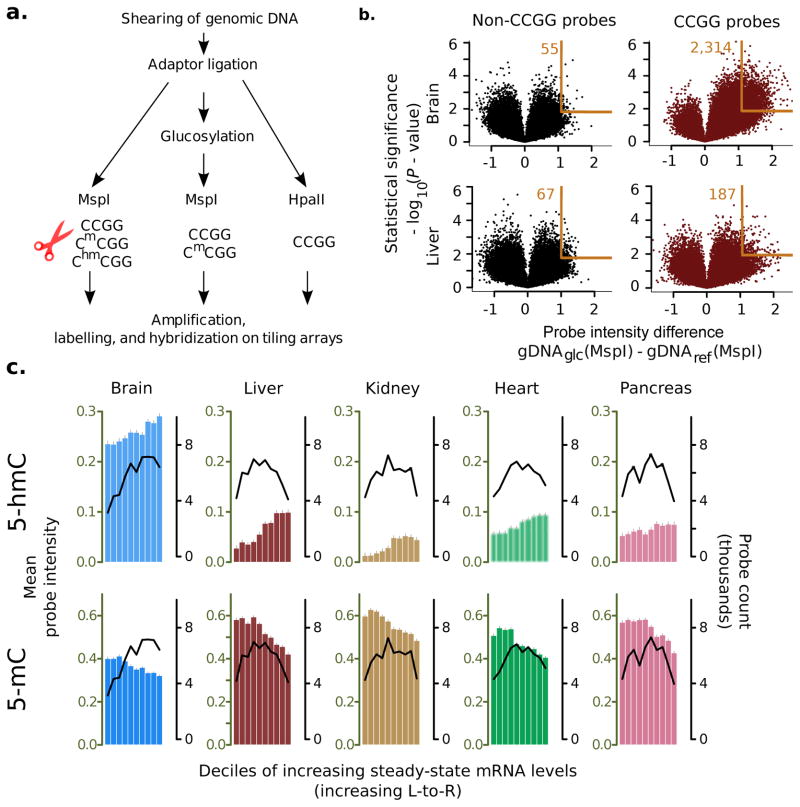
Figure 1. 5-hmC measurement assay, array validation, and relationship to steady state mRNA levels.
(a) Experimental method for 5-hmC and 5-mC measurement on microarrays. (b) Volcano plots showing single microarray probe detection of 5-hmC in the mouse brain (top row, n = 11 samples) and liver (bottom row, n = 9 samples). Non-target sequences (left) are not affected by DNA glucosylation, resulting in a symmetric zero-centered distribution of intensities, while signals from target probes (right) are shifted to the upper-right, indicating protection of MspI targets after DNA glucosylation (orange rectangle; number beside rectangle shows probes that fall in the region). Mouse brain samples contain relatively larger 5-hmC densities as evidence. d by a greater shift in the corresponding volcano. X-axis: log difference in intensity of glucosylated DNA (gDNAglc) relative to unglucosylated DNA (gDNAref); y-axis: statistical significance of change (two-tailed t-test). (c) Average levels of 5-hmC (top) and 5-mC (bottom) in gene bodies (transcription start site to transcription end site) of various mouse tissues. Bars measure mean probe intensities (errors show standard error of mean); genes are grouped by deciles of increasing tissue-specific steady state mRNA levels. Black trendlines show number of probes per decile.

