
Figure 2. Levels of 5-hmC in mouse and human brains is higher in synapse-related genes, relative to other genes.
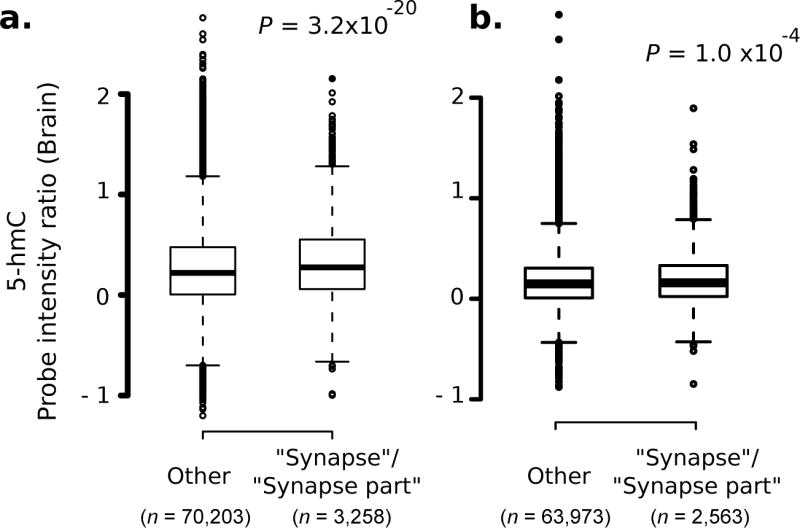
Intensity distribution of all probes in genes mapped to GO categories “synapse” and “synapse part”, relative to that in other genes. Data shown for (a) mouse and (b) human brain samples Mouse: six chromosomes, two-tailed WMW test. Human: six chromosomes, one-tailed WMW test. n denotes number of probes.