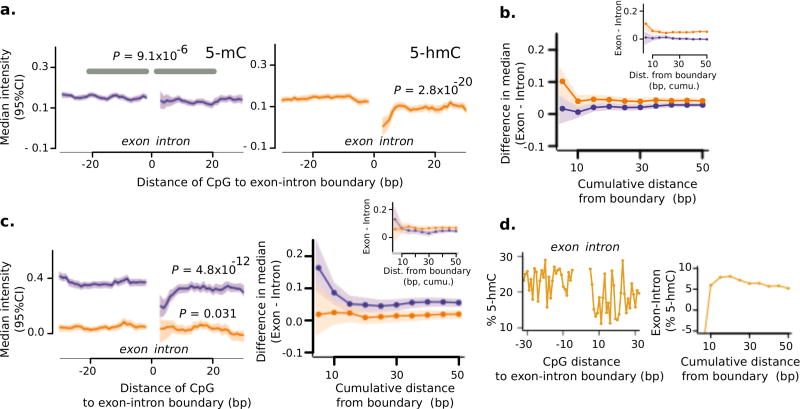
Figure 3. 5-hmC marks exon-intron boundaries in the human brain, and 5-mC marks that in the human liver.
(a) Probe intensities for 5-mC (left) and 5-hmC (right) as a function of distance from the boundary (28 brain samples, 6 chromosomes); x-axis: distance (bp) of modifiable cytosine from boundary. y-axis: median intensity of sample-averaged probes (5bp centered smoothing). P-values are from linear mixed-effects model (exon versus intron, d < 20bp from boundary); shading shows 95 % CI. (b) Cross-boundary differences for larger cumulative distances (d = 5–50 bp) from boundary. Inset: The dominant marking of 5-hmC was replicated in independent biological replicates (brain samples from patients diagnosed with psychosis, n = 54, 3 chromosomes). Shading shows 95%CI from bootstrapping exonic and intronic intensities separately. (c) Modifications in DNA from the human liver (n = 13, 3 chromosomes); left shows a detailed view around the boundary, while right shows cross-boundary changes at larger distances. Inset: Same view for age- and sex-matched brain samples done as a paired control. (d) Validation by single molecule sequencing. Left: Cross-boundary 5-hmC from a single human brain sample. Right: Relative exonic increase in % 5-hmC for cumulative distances from the boundary (d = 5–50 bp).

