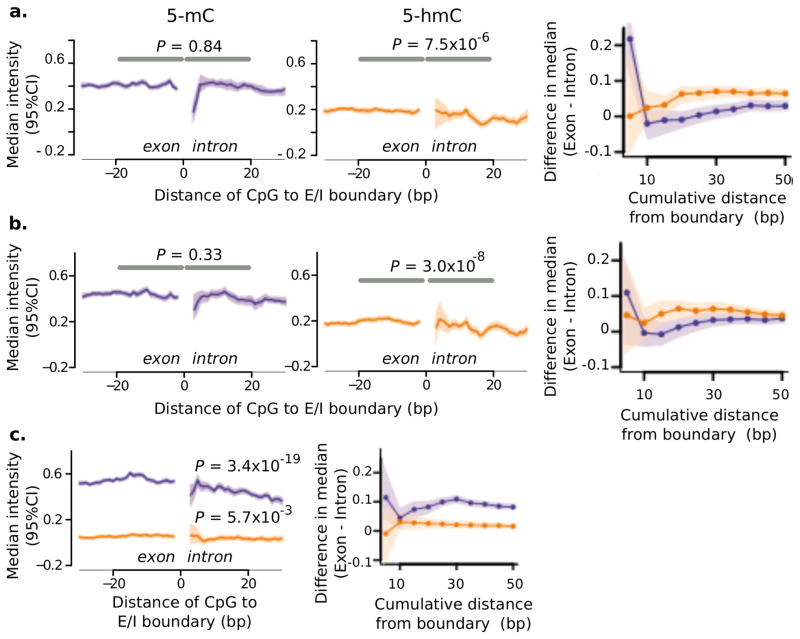
Figure 4. 5-hmC marks exon-intron boundaries in the mouse brain, but not in mouse organs of non-neural origin.
Peri-boundary modifications in DNA in the mouse brain: (a) frontal cortex, and (b) remainder (n = 15 animals per group, 3 chromosomes). Figure details are as those for Fig. 3. Left, middle: Median intensities around the exon-intron boundary. Right: Relative exonic increase at various cumulative distances from the boundary. (c) DNA modifications in non-neural mouse organs (n = 24 animals, 6 chromosomes; DNA from heart, liver, pancreas and kidney).

