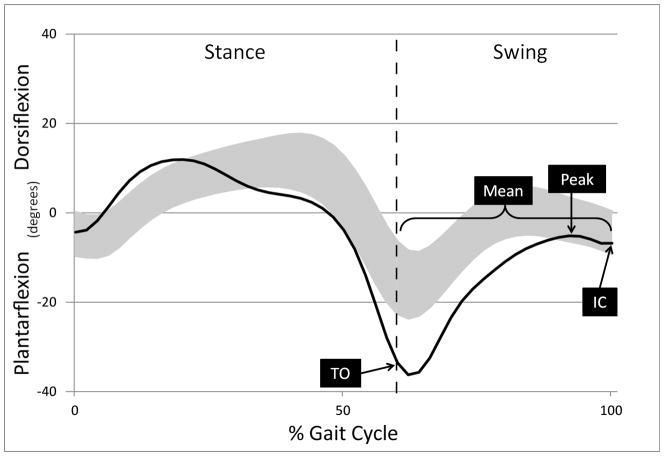
Figure 2.
Kinematic gait variables are noted on representative mean ankle angle data from one participant (black line) during the gait cycle (foot contact, 0%, to subsequent foot contact, 100%). The gray band represents one standard deviation around the mean for typical gait. Stance phase is the period when the limb is in contact with the ground, swing phase is the period when the limb is not in contact with the ground and is advancing forward. The transition from stance to swing phase (toe-off) is noted by the dashed vertical line. TO, ankle angle at toe-off; Peak, maximum dorsiflexion in swing; Mean, mean ankle angle in swing; IC, ankle angle at initial floor contact.

