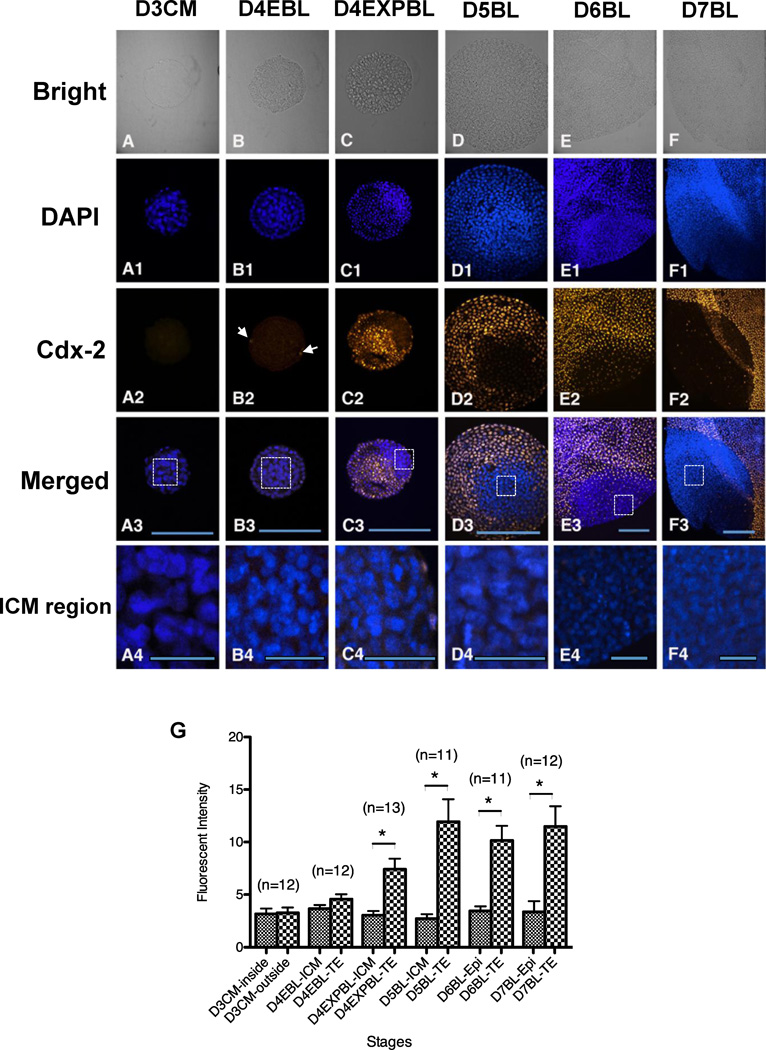
Figure 3.
Cdx-2 protein expression in in-vivo-derived rabbit embryos. Embryos were used for double labelling of DNA with DAPI (blue) and Cdx-2 with antibody (yellow, pseudocolour assigned by Volocity). A representative single section of individual embryo across the major ICM and TE areas was selected for analysis and the intensity of Cdx-2 signals were quantitated. Cdx-2 (A–A4) Cdx-2 was undetectable in day-3 compact morulae (n = 12). (B–B4) In some of day-4 early blastocysts (3/12), Cdx-2 signals were shown in few TE cells (arrows). (C–C4) The Cdx-2 signal became evident in day-4 expanded blastocysts (n = 13), co-localized with the TE cells, but not with the ICM cells. (D–F4) Thereafter, Cdx-2 was expressed only in TE lineage of in day-5 blastocysts (D–D4, n = 11), day-6 blastocysts (E–E4, n = 11) and day-7 blastocysts (F–F4, n = 12). (G) Comparison of the Cdx-2 signal intensity of different regions in embryos collected at different stages. Significantly different Cdx-2 intensity was found at the day-4 expanded blastocyst stage (P < 0.05), showing stronger Cdx-2 intensity in the TE regions compared with the ICM. Because the Cdx-2 signals were not visually observed in both ICM and TE regions of day-3 compact morulae and the ICM/epiblast regions of day-4–7 blastocysts, the measured Cdx-2 intensity can be considered as a background value. In merged figures (A3–F3), the ICM regions in rectangles were magnified and Cdx-2 signals were not detected by the current method (A4–F4). D3CM = day-3 compact morulae; D4EBL = day-4 early blastocysts; D4EXPBL = day-4 expanded blastocysts; D5BL = day-5 blastocysts; D6BL = day-6 blastocysts; D7BL = day-7 blastocysts; Epi = epiblast; ICM = inner cell mass; TE = trophectoderm. Asterisks indicate statistically significant differences (P < 0.05). Bars = 200 µm (A3–F3) and 50 µm (A4–F4).

