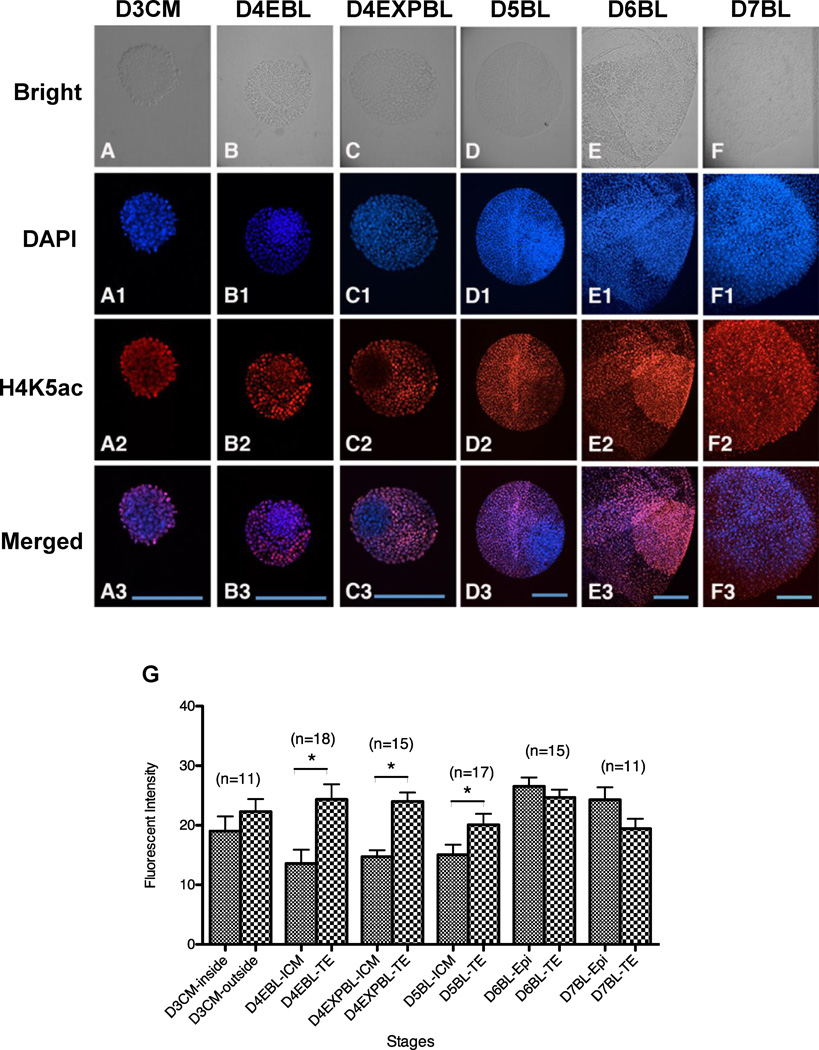
Figure 4.
Acetylation pattern of H4K5 in in-vivo-derived rabbit embryos. Embryos were fixed for double staining of DNA with DAPI (blue) and acetylated H4K5 with antibody (red) and the intensity of H4K5ac signals were quantitated. (A–D3) A stronger H4K5ac signal was shown in the outside area of day-3 compact morulae (A–A3, n = 11), in the TE cells of day-4 early blastocysts (B–B3, n = 18), day-4 expanded blastocysts (C–C3, n = 15) and day-5 blastocysts (D–D3, n = 17), compared with the inside area of day-3 compact morulae and ICM of day-4 early blastocysts, day-4 expanded blastocysts and day-5 blastocysts, respectively. (E–F3) A reverse of this trend was observed starting in day-6 blastocysts. The H4K5ac intensity in the epiblast appeared higher than that in the TE cells of day-6 (E–E3, n = 15) and day-7 blastocysts (F–F3, n = 11). (G) Analysis of H4K5ac revealed that its signal was significantly weaker in the ICM than in the TE cells in day-4 early blastocysts, day-4 expanded blastocysts and day-5 blastocysts (P < 0.05). On the contrary, H4K5ac intensity was similar between the ICM and TE cells in day-6 and day-7 blastocysts, as well as between the outside and inside regions of day-3 compact morulae. D3CM = day-3 compact morulae; D4EBL = day-4 early blastocysts; D4EXPBL = day-4 expanded blastocysts; D5BL = day-5 blastocysts; D6BL = day-6 blastocysts; D7BL = day-7 blastocysts; Epi = epiblast; ICM = inner cell mass; TE = trophectoderm. Asterisks indicate statistically significant differences (P < 0.05). Bars = 200 µm.

