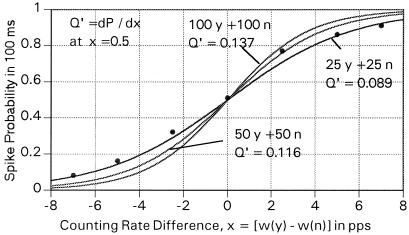
Figure 5.
The yes probability, defined by the receipt of one or more output pulses in a 1/10 s-interval, from a vernier (coincidence-anticoincidence) network as a function of the frequency difference between two sets of primary elements, where each set consists of 100 yes (y) elements in coincidence and 100 no (n) elements in anticoincidence and sets of 50 y and 50 n and 25 y and 25 n elements. The curves represent the best fit to sigmoid functions described in the text to points generated through Monte Carlo calculations. The points are shown for the (25 y + 25 n) results to suggest the quality of the fit to the points. In each case, the primary pulse length was taken as 10 ms.

