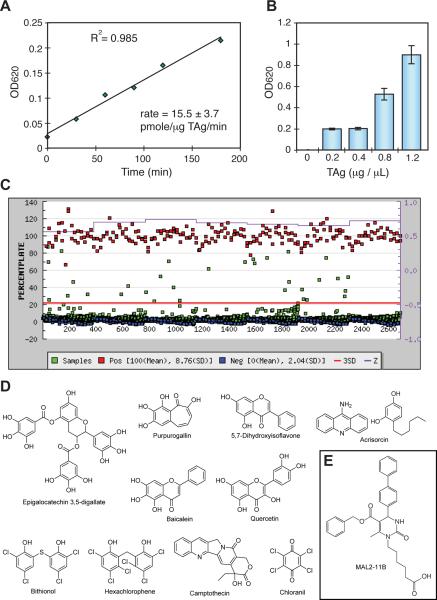
Figure 1.
Development of a high throughput screen for TAg. A. The signal is linear for at least 3 hours at 0.20 μg/well (2.5 nM) of TAg, 1 mM ATP and 37 °C. Phosphate levels were measured using quinaldine red (QR) and converted to pmoles using a set of sodium phosphate standards. B. Relationship between TAg concentration and raw phosphate signal (OD620). To conserve protein, 0.20 μg per well (2.5 nM) was chosen for screening. Results are the average of triplicate wells and the error bars represent the standard deviation (SD). C. The results from screening the MS2000 collection. TAg was screened in 384-well plates, as described in the Materials and methods. The red line is 3 standard deviations of the negative control. The purple line is the Z factor, calculated by plate. The controls (positive (red): no enzyme; negative (blue): DMSO) were present on each plate. D. Chemical structures of the active compounds from the MS2000 collection that were confirmed in duplicate and then screened in the steady-state, radioactive ATPase assay (see Figure 2). E. The structure of MAL2-11B is shown for comparison.

