Abstract
Magnetization Prepared Rapid Acquisition Gradient Echo (3D MPRAGE) has been shown to be a sensitive method to image carotid intraplaque hemorrhage (IPH). Since the MPRAGE sequence used to identify potential IPH does not utilize cardiac gating, it is difficult to optimize the inversion times due to the dynamic nature of flowing blood. As a result, a best fit inversion time is often determined experimentally and then used for in vivo clinical examination. This results in compromised blood suppression and occasional hemorrhage mimicking flow artifacts. We demonstrate that a retrospective cardiac correlated reconstruction can be applied to the conventional MPRAGE sequence (CineMPRAGE) to more accurately identify blood signal. This CineMPRAGE reconstruction uses the data from a standard non-gated MPRAGE sequence to generate a full sequence of cardiac correlated images throughout the cardiac cycle and therefore provides a dynamic view of the carotid artery and a better ability to discern blood signal from potential intraplaque hemorrhage. In our preliminary study of 35 patients, signal from potential hemorrhage was constant over the cardiac cycle while any signal from blood flow artifact was observed as an oscillating signal over the cardiac cycle.
Keywords: MPRAGE, Intraplaque Hemorrhage, Flow Artifact, Flow Suppression, Carotid Plaque
INTRODUCTION
Patients with stable or inactive carotid plaques may not be at increased risk of stroke and may be spared intervention if such lesions can be accurately characterized. Studies have shown that intraplaque hemorrhage (IPH) is highly correlated with neurologic events in patients with carotid stenosis (1–3). Hemorrhage is therefore an important plaque component and can be identified using a T1-weighted MRI sequence (4–7). Ota et al. compared three different T1-weighted sequences and concluded that magnetization prepared rapid acquisition gradient echo (MPRAGE) exhibited higher diagnostic capability for the detection and quantification of intraplaque hemorrhage (8). The basic premise of the MPRAGE sequence is that tissue with long T1 relaxation times (blood and muscle) can be differentiated from tissue with short T1 relaxation times (hemorrhage and fat) using inversion recovery (5). When identification of hemorrhage is desired, a variety of methods are available to suppress or identify the fat signal (9, 10).
MPRAGE utilizes a non-selective inversion pulse followed by selective excitation after a prescribed inversion time. However, flowing blood will leave the volume covered by the inversion pulse after a short period of time and will not experience the same number of inversion pulses that stationary tissue will. Furthermore, fast flowing blood may not have experienced any inversion pulse before reaching the imaging volume. Since the velocity of blood is correlated to the cardiac cycle, the absence of an inversion pulse for flowing blood depends on the timing of the inversion pulse relative to the cardiac cycle. The inversion time that minimizes the signal from flowing blood depends on the number of inversion pulses flowing blood will experience. The optimum inversion time is therefore not a constant single value throughout the scan, but should be changed during image acquisition depending on the timing of the inversion pulse relative to the cardiac cycle. Despite this, MPRAGE is typically applied without cardiac gating and a constant “best fit” inversion time is determined experimentally to minimize the signal from flowing blood and other non-hemorrhage tissues to allow for maximum hemorrhage contrast (4, 6, 11–14). Due to the dynamic nature of flowing blood and differences in velocity profiles across a patient population, this “best fit” inversion time can fail to null the blood signal in all cases and result in hemorrhage mimicking flow artifacts.
Even if a “best fit” inversion time were optimized to each individual patient, there is no guarantee that this method will produce satisfactory results in any given scan due to variations in that individual’s heart rate. Gating the MPRAGE sequence creates a varying time between inversion pulses and still requires dynamic computation and changing of the inversion times throughout the scan. A motion sensitized driven equilibrium preparation could be added between the inversion pulse and data acquisition to help null any remaining blood signal (15). However, Wang et al. reported that such a preparation results in a SNR loss of 12% and many MPRAGE protocols already must acquire multiple averages due to the low SNR of the sequence. Inflow saturation methods would help but are known to be less effective in eliminating blood signal in the presence of complicated flow patterns like those near the carotid bifurcation (16).
We have developed a retrospectively cardiac correlated reconstruction method for traditional MPRAGE (CineMPRAGE) to more accurately identify blood signal. The basic design of our study was to 1) establish conditions that potentially produce hemorrhage mimicking flow artifacts, 2) show that a single “best fit” inversion time does not reproducibly suppress blood flow, 3) demonstrate the ability of CineMPRAGE to identify flow artifact and 4) present some cases where CineMPRAGE was applied to patients with known carotid disease.
THEORY
A pulse oximeter or electrocardiogram was used to record the timing of the patient’s cardiac cycle during the MR scan. After the data was acquired with a standard MPRAGE sequence, the acquired k-space lines were retrospectively sorted into Ntcardiac phases based on the time elapsed since the last systolic trigger (5, 8, 17). The result was an undersampled 4D data matrix M of size (Nx,Ny,Nz,Nt). The undersampled data was reconstructed using Robust Principle Component Analysis (18). In this algorithm our data M was decomposed into a temporally low-rank matrix L and a sparse corruption matrix S:
| [1] |
Consider a function, ψ, that rearranges a 4D matrix of size (Nx,Ny,Nz,Nt) to a 2D matrix of size (NxNyNz,Nt). The Robust Principle Component problem is described as a minimization of:
| [2] |
subject to:
| [3] |
where ‖ ‖* is the nuclear norm (sum of the singular values), ‖ ‖1 is the ℓ1-norm, λ is a weighting factor, W is a function specifying the sampled lines of k-space, and ℱ is the Fourier transform. Candès et al. showed that a practical solution is the use of principal component pursuit by alternating directions (18, 19). We have observed that a good balance of temporal resolution, computation time and data undersampling artifact was achieved when data was sorted into 12 cardiac phases (17).
METHOD
All studies were performed on a Siemens Trio 3T MRI scanner with custom designed 4 or 16 element phased array surface coils (20, 21). All human studies were approved by the institutional review board and informed consent was obtained from all subjects. The first three objectives of this study were to identify conditions which potentially produce hemorrhage mimicking flow artifacts, show that a “best fit” inversion time does not reproducibly suppress blood flow and demonstrate the feasibility of CineMPRAGE to identify flow artifacts. To investigate these three objectives, a low cost pulsatile flow phantom was constructed (Appendix A).
Flow Phantom Studies
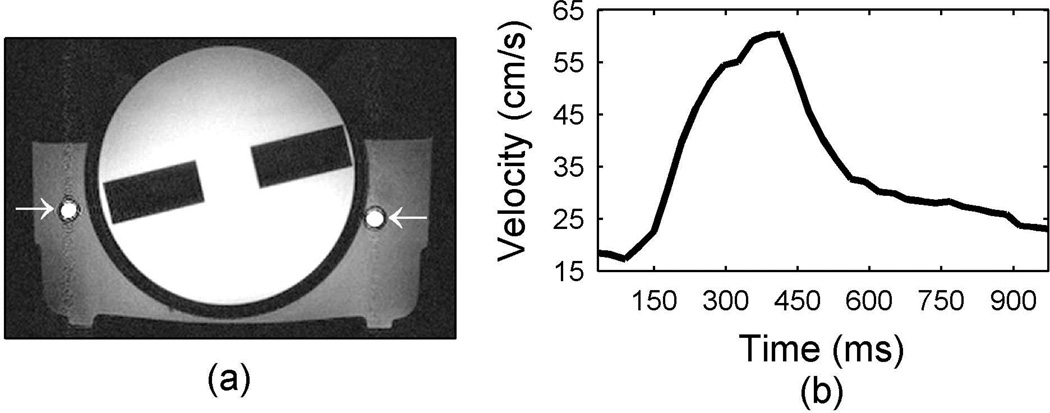
An axial slice through the phantom (Fig. 1a) shows the general geometry of the three different compartments of the flow phantom. There was a cylindrical center with a measured T1 relaxation time of approximately 900 ms and adjacent tubing containing flowing tap water surrounded by stationary tap water (T1~1500ms). These T1 relaxation times were similar to those of muscle and blood at 3 Tesla and allowed the same pulse sequence to be used on the flow phantom as well as human subjects (4, 22). The water travelled through 6m of tubing from the pump to the foot of the flow phantom where it passed through 7m of coiled tubing reservoir, in the 3 T field but not necessarily in the 50 cm diameter homogeneous magnetic imaging field of view, before entering the flow phantom. The coiled tubing reservoir replicated the effect of blood in the heart before entering the carotid artery. After flowing through the phantom the water returned straight to the pump reservoir for a total distance of approximately 20m through 0.5cm tubing. All velocities reported were measured with a fully sampled cine phase contrast gradient echo MR sequence (0.75×0.75×3mm resolution, 15° flip angle, 3 averages, 33 measured phases for pulsatile flow with only the through plane velocity measured). For the pulsatile flow used in this work, a typical temporal velocity profile at the center of the supply tube is shown in Fig. 1b.
Figure 1.
Flow phantom used in this work. A 2D axial gradient echo image through the flow phantom is shown in (a) with the arrows indicating the supply and return tubes on the left and right respectively. The phantom has an inner cylindrical compartment with a T1 of 900ms while the tap water flowing inside and the stationary tap water surrounding the tubes has an approximate T1 of 1500ms. The waveform in (b) shows the velocity measured in the supply tube when a 300ms square voltage pulse is supplied to the pump with a frequency of 1 Hz.
Conditions that potentially produce hemorrhage mimicking flow artifacts were examined using the flow phantom set to constant flow with velocities ranging from 8cm/s to 63cm/s. Fully sampled MPRAGE images (200mm×200mm×24mm field of view, 294×256×10 matrix, TI=370ms, TE=2.22ms, 15° flip angle and 1 average) were acquired at multiple velocities. MPRAGE data was segmented such that 49 phase encode lines were acquired each TR interval. Six segments were required (each of length TR=667ms) to acquire all the phase encode lines before moving on to the next partition in the 3D data set. These experiments were performed twice, once with the coiled tubing reservoir near isocenter and once with the coiled tubing reservoir about 30cm from isocenter.
Human Studies
The final objective of this work was to apply CineMPRAGE to in vivo patient studies. For patient studies, the MPRAGE sequence was configured with a 130mm×130mm×48mm field of view, 294×256×48 matrix, TR=667ms, TI=370ms, TE=2.22ms, 15° flip angle and 2 averages (6 minute 24 second total scan time). Data was again acquired with 6 segments per partition encode. A chemical shift fat saturation RF pulse was applied to eliminate perivascular fat. Each MPRAGE data set was reconstructed using the standard method (Fourier transform) and the CineMPRAGE technique described above. For the CineMPRAGE, every line of k-space was sampled in at least one of the cardiac phases and the initial image estimates, L, are created using linear interpolation in the temporal direction. The strength of the weight factor λ is a tradeoff between temporal blurring, undersampling artifact reduction and image noise. Decreasing the factor λ results in improved suppression of undersampling artifacts but increased temporal blurring with a SNR in each CineMPRAGE image that approaches that of the standard MPRAGE image. Conversely, increasing the weight factor can result in poor undersampling artifact suppression but reduced temporal blurring with a SNR in each CineMPRAGE image that approaches the SNR of a single average MPRAGE image. The weight factor λ was chosen as suggested in (18):
| [4] |
A patient was considered to have a MPRAGE positive signal if any area in the image had a mean intensity greater than 1.5× the intensity of the sternocleidomastoid muscle. The intensity of the sternocleidomastoid muscle was measured by drawing a region of interest (typically 0.25cm2) in an area of the muscle close to the carotid artery. The mean signal in any 3×3 pixel area was then compared to the mean intensity of the sternocleidomastoid muscle to determine if it exceeded the threshold for a MPRAGE positive signal. SNR measurements were calculated by taking the same mean intensity of the sternocleidomastoid muscle compared to the standard deviation of the noise measured outside of the object.
Other reference data presented in this paper include 3D time of flight (160mm×160mm×48mm field of view, 512×512×24 matrix, TR=25ms, TE=4.02ms, 50° flip angle and 1 average), 2D T1 weighted turbo spin echo with inversion recovery dark blood preparation (130mm×130mm×2mm field of view, 512×512 matrix, TI=500ms, TR=25ms, TE=9.2ms, echo train length of 9 and 2 averages), and 2D phase contrast (140mm×140mm×5mm field of view, 256×256 matrix, TR=694ms, TE=4.91ms, 15° flip angle, 25 cardiac phases and 1 average).
RESULTS
The coverage of the non-selective inversion pulse in the described MPRAGE sequence was limited by the field of view of the transmit coil and increasing magnetic field inhomogeneity at large distances from the magnet isocenter. In our scanner, and in many clinical MR scanners, the non-selective inversion pulse had a maximum effective range of approximately ±25 cm from the magnet isocenter along the bore. In this paper we refer to this 50cm region as the MRI scanner effective field of view.
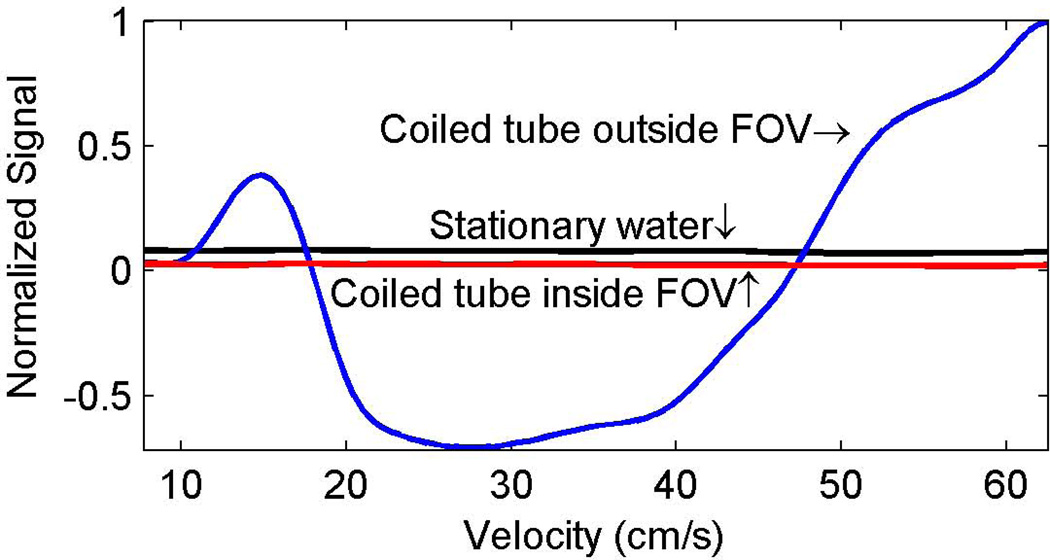
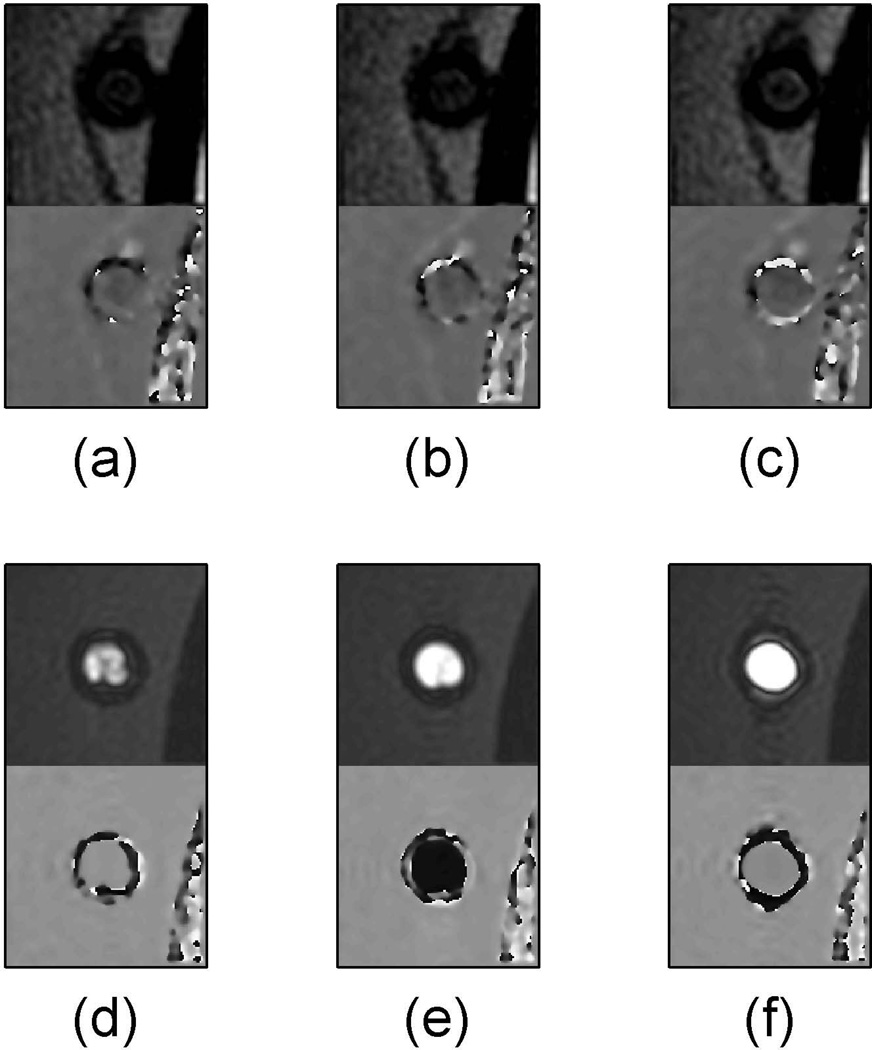
The effect of constant velocity on flow suppression with the described MPRAGE sequence is demonstrated in the plot of Fig. 2 and the images of Fig. 3. In the plot, a negative signal for flowing water occurred when it was out of phase with the surrounding stationary water. Signal from the surrounding stationary water (black line in Fig. 2) and the flowing water when the coiled tube reservoir was inside the MRI scanner effective field of view (red line in Fig. 2) were stable across the tested range of velocities. The signal from flowing water when the coiled tube reservoir was outside the MRI scanner effective field of view (blue line in Fig. 2) had strong velocity dependence. The flow velocity dependence effect is also demonstrated in the images in Figure 3. When the coiled tube reservoir was inside the MRI scanner effective field of view (Fig. 3a to 3c), the signal from flowing water inside the supply tube was adequately suppressed for all three velocities tested (15cm/s, 27cm/s and 62cm/s). However, when the coiled tube reservoir was outside the MRI scanner effective field of view, flowing water was hyperintense relative to stationary water for all three velocities, but was in phase with respect to the stationary water for slower (Fig. 3d) and higher (Fig. 3f) velocities and out of phase relative to stationary water for the constant velocity of 27cm/s (Fig. 3e).
Figure 2.
Velocity dependence of signal suppression in a flow phantom with the described 3D MPRAGE. The flow signals (red and blue lines) were measured as the mean signal across the supply tube (left arrow in Fig. 1a) while the surrounding stationary water (black line) was the mean signal over a 1cm field of view near the supply tube. Negative flow signal intensity indicates that flowing water was out of phase with the surrounding water. When the coiled tube (red line) was inside the MRI scanner effective field of view there was nice suppression of flow signal over the entire range of velocities. However, when the coiled tube was outside the MRI scanner effective field of view, there was a potential for hemorrhage mimicking artifacts across a wide range of flow velocities.
Figure 3.
The supply tube (left arrow in Fig. 1a) is shown from a select partition of a 3D MPRAGE axial slab for various flow velocities. The magnitude image is displayed above the phase image for each of (a) through (f). The images (a–c) have the coiled tubing reservoir inside the MRI scanner effective field of view while (d–f) have the coiled tubing reservoir outside the effective magnetic imaging field of view. The images shown are for flow velocities of 15cm/s (a and d), 27cm/s (b and e) and 62cm/s (c and f).
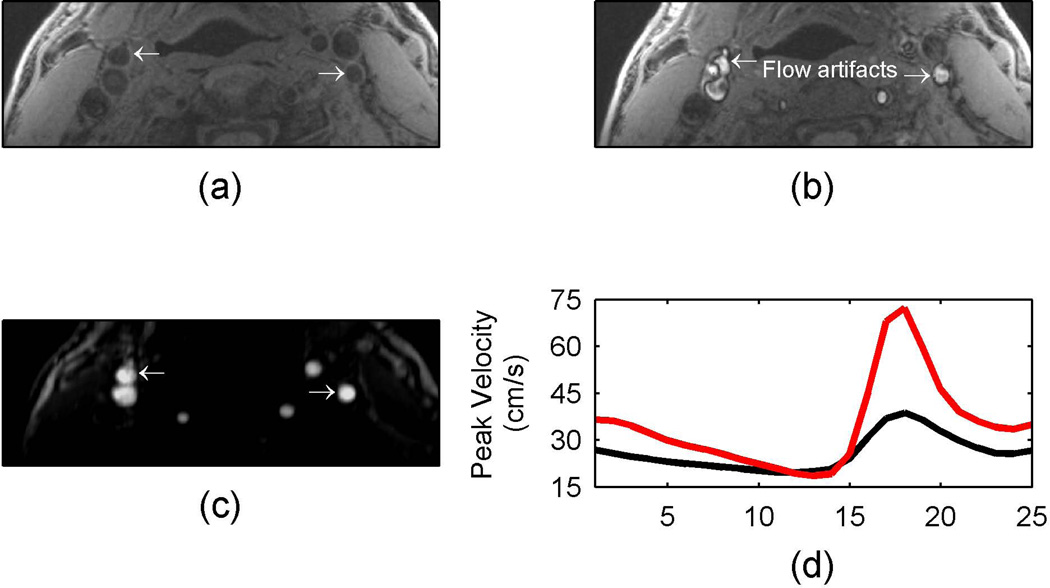
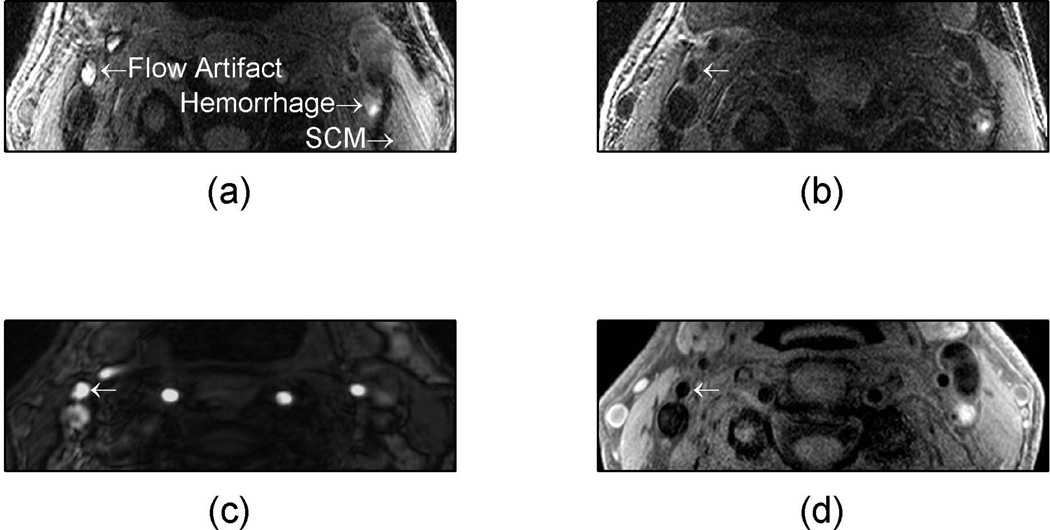
The patient position inside the MR scanner is an important factor in flow suppression with MPRAGE sequences. When a volunteer was placed with the carotid bifurcation at the magnet isocenter, there was no MPRAGE positive signal observed (Fig 4a). When the patient was moved 15cm to the foot of the magnet and rescanned, a hemorrhage mimicking artifact was observed (arrows in Fig 4b). To help verify the presence of a flow artifact, time-of-flight (Fig. 4c) and a phase contrast velocity measurements (Fig. 4d) were included. The 3D time-of-flight images had bright signal in the area of suspected flow artifact and velocity measurements from phase contrast imaging indicated blood flow.
Figure 4.
In vivo example of MPRAGE hemorrhage mimicking flow artifact at different volunteer positions. When the volunteer was placed with the carotid bifurcation at the magnet isocenter, there was no MPRAGE positive signal observed (a). When the patient was moved 15 cm to the foot of the magnet and rescanned, a hemorrhage mimicking artifact was observed (arrows in b). The flow artifact is verified by the bright signal in the time-of-flight image (c) and the velocity profiles (d). The red line indicates the velocity profile in the left internal carotid artery while the black line indicates the velocity profile in the right external carotid artery.
The failure of MPRAGE to identify flow artifact in a patient with carotid disease is demonstrated in Fig. 5. If potential hemorrhage was identified using a MPRAGE intensity threshold of 1.5× the intensity of the sternocleidomastoid muscle, then there were several areas of potential hemorrhage (Fig. 5a). In addition, the same patient was subsequently reimaged with the identical sequence (patient positioned 4cm closer to the foot of the magnet) with a greatly reduced flow artifact as shown in Fig. 5b. The signal intensity from the potential hemorrhage was similar for both scans (compare Fig. 5a to Fig. 5b). To help verify the presence of flow artifact (Fig. 5a), the images from a time-of-flight and T1w dark blood turbo spin echo sequences are also shown (Fig. 5c and 5d respectively). The time-of-flight (Fig. 5c) had a bright signal where the flow artifact was suspected and the dark blood T1 weighted image (Fig. 5d) was dark in the area of the flow artifact.
Figure 5.
In vivo example of hemorrhage mimicking flow artifact with 3D MPRAGE. A patient was imaged and had a suspected hemorrhage mimicking flow artifact (a) which was absent when the patient was rescanned (b). The time-of-flight (c) had a bright signal where the flow artifact was suspected and the dark blood T1 weighted image (d) was dark in the area of the flow artifact.
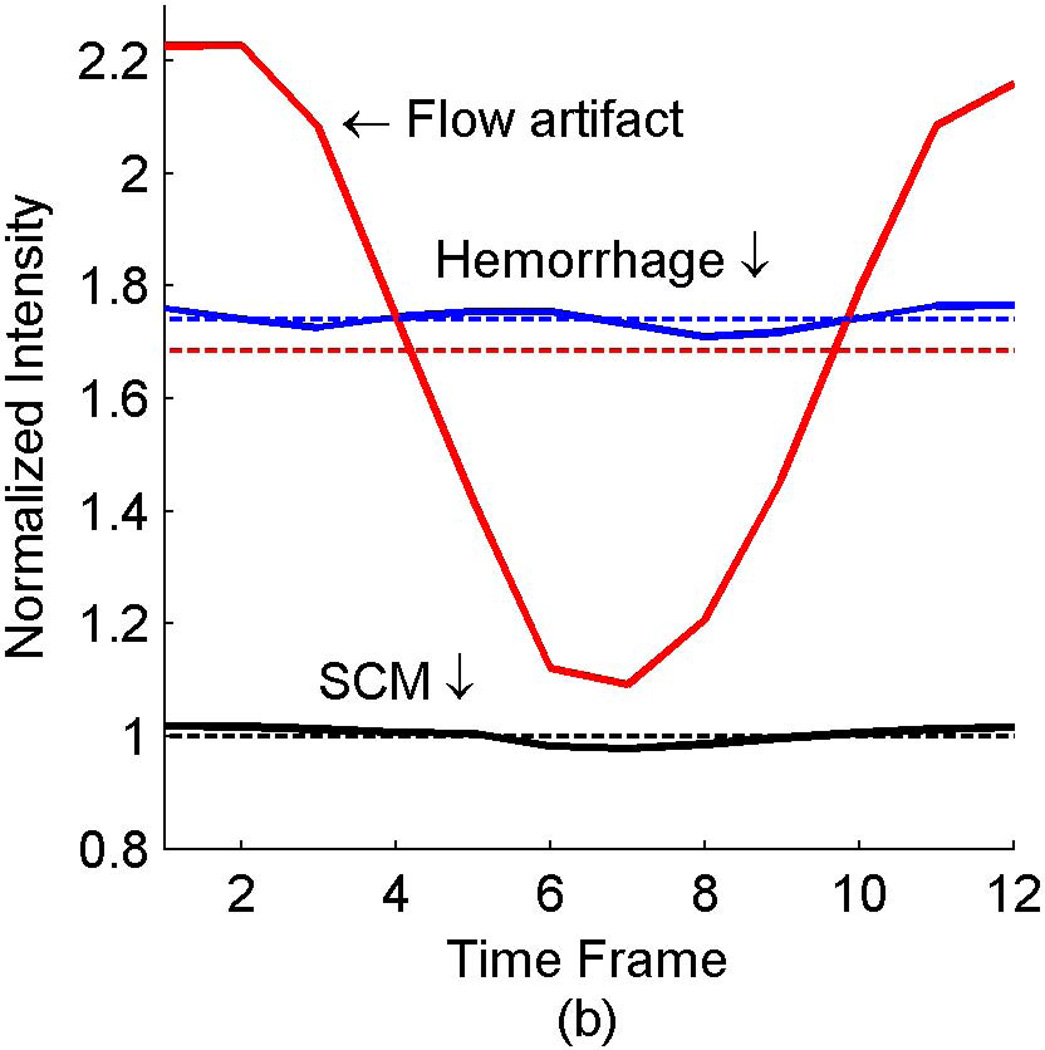
The signals from three identified areas of a patient with known carotid disease (arrows in Fig. 5a) are quantified with the dashed lines in Fig. 6. The signal from the flow artifact (red dashed line in Fig. 6) was 1.7× the intensity of the sternocleidomastoid muscle and could therefore be misclassified as potential hemorrhage. The potential hemorrhage signal (blue dashed line in Fig. 6) was 1.8× the intensity of the sternocleidomastoid muscle. The same data was then reconstructed with the CineMPRAGE technique described in this work. The resulting signals of the same regions of interest (arrows in Fig. 5a) are represented by the solid lines in Fig. 6. The signal intensities from the sternocleidomastoid muscle (black solid line in Fig. 6) and potential hemorrhage (blue solid line in Fig. 6) were relatively constant throughout the cardiac cycle. However, the signal from the flow artifact (red solid line in Fig. 6) varied with the cardiac cycle. The flow artifact intensity ranged from 1.1× to 2.2× the intensity of the sternocleidomastoid muscle.
Figure 6.
In vivo example of hemorrhage mimicking flow artifact with 3D MPRAGE. The signal intensities from select regions (labeled in Fig. 5a) are shown with the dashed lines representing the standard MPRAGE reconstruction and solid lines representing the CineMPRAGE reconstruction. The signal intensities from the flow artifact are shown in red, potential hemorrhage in blue and the sternocleidomastoid muscle in black. In the standard MPRAGE reconstruction (dashed lines), the intensity of the flow artifact is larger than 1.5× the sternocleidomastoid muscle (a common threshold to identify potential hemorrhage).
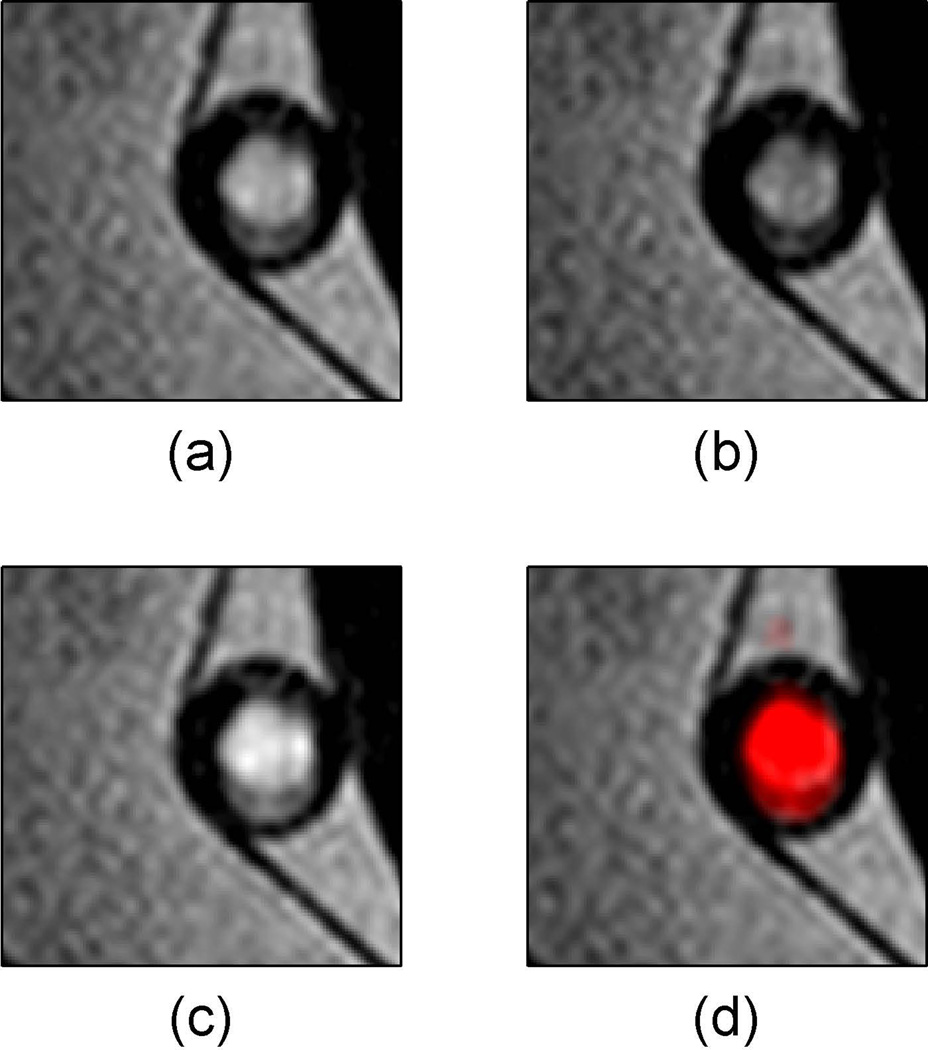
Signal from flow artifacts can be discerned by taking the temporal maximum and minimum intensity projections of the CineMPRAGE reconstruction as shown in Figure 7. In this case, the described MPRAGE sequence failed to suppress flowing water in a pulsatile flow pump (Fig. 7a). The minimum and maximum intensity projections (MinIP and MaxIP respectively) along the temporal direction of the CineMPRAGE reconstruction are shown in Fig. 7b and 7c respectively. While the stationary water had the same intensity in both projections, the flow artifact varied between the minimum and maximum intensity projections. A color map corresponding to the CineMPRAGE signal variation was overlaid on the conventional MPRAGE image in Fig. 7d.
Figure 7.
Identification of flow artifact using minimum and maximum intensity projections with CineMPRAGE. The described MPRAGE sequence failed to suppress flowing water in a pulsatile flow pump (a). The minimum and maximum intensity projections along the temporal direction of the CineMPRAGE reconstruction are shown in (b) and (c) respectively. A color map corresponding to the CineMPRAGE signal variation is overlaid on the conventional MPRAGE image in (d).
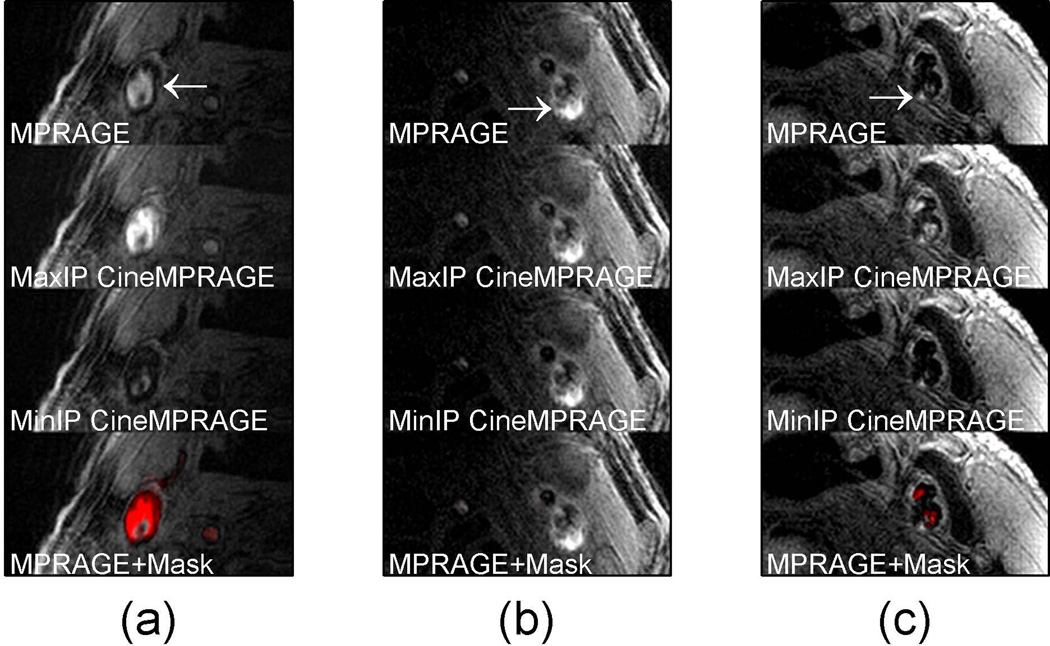
Similarly, in patients, a flow artifact which varied across the cardiac cycle had a large difference between the MaxIP and MinIP CineMPRAGE intensity projections (compare Fig. 8a second and third rows). However, signal from potential hemorrhage was relatively consistent across the cardiac cycle and minimum and maximum intensity projections of the CineMPRAGE reconstruction were almost identical (compare Fig. 8b second and third rows). Color maps corresponding to the CineMPRAGE signal variation were overlaid on the conventional MPRAGE images on the bottom row of Fig. 8.
Figure 8.
Identification of potential hemorrhage and hemorrhage mimicking flow artifacts using CineMPRAGE image reconstruction. A patient with flow artifact is shown in (a) while patients with potential intraplaque hemorrhage are shown in (b) and (c). The top row is the MPRAGE images reconstructed using the standard MPRAGE technique. In all cases there are pixels with signal intensities above 1.5× sternocleidomastoid muscle. The maximum and minimum intensity projections (taken along the temporal direction) of the CineMPRAGE reconstruction are shown in the second and third rows respectively. While the potential hemorrhage signal is constant, the flow artifact is varies across the cardiac cycle as evidenced by the difference in the maximum and minimum intensity projections. Color maps corresponding to the CineMPRAGE signal variation are overlaid on the conventional MPRAGE images on the bottom row.
Signal-to-noise, hemorrhage/SCM and Flow artifact/SCM ratios are summarized in Table 1. Patients 1 through 3 have images shown in Fig. 8a to 8c respectively. The SCM SNR is higher in Patient 1 because a 16 channel receive coil was used instead of the 4 channel receive coil used with patients 2 and 3. Most of the 35 total patients were imaged using the 4 channel receive coil. The average SNR of the sternocleidomastoid muscle was about 15% higher in the MPRAGE image compared to the average SNR of each individual CineMPRAGE image. In the preliminary patient population studied, 22 of the 35 cases had an MPRAGE positive signal indicating potential hemorrhage. In all these cases, the CineMPRAGE sequence identified the positive MPRAGE signal and never produced a positive signal when one was not present on the standard MPRAGE images. While about half of the 35 patients exhibited flow artifact to some degree, only 5 had a flow artifact that would be potentially misclassified as hemorrhage. In these 5 cases, the traditional technique (MPRAGE) would misidentify flow artifact as potential hemorrhage but CineMPRAGE was able to make the distinction (see summary for all patients in Table 1).
Table 1.
Patient data signal-to-noise, hemorrhage/SCM and Lumen/SCM ratios.
| Patient 1a | Patient 2b | Patient 3b | 35 Patients | |
|---|---|---|---|---|
| SCM SNR (MPRAGE) | 53.2 | 26.0 | 21.0 | 22.6 ±15.7 |
| SCM SNR (Cine MPRAGE) | 39.0 | 23.3 | 19.4 | 19.1 ±11.4 |
| Hemorrhage/SCM Ratio (MPRAGE) | N/A | 1.7 | 2.0 | 2.3±0.9 |
| Hemorrhage/SCM Ratio (MaxIP CineMPRAGE) | N/A | 1.7 | 2.1 | 2.4±0.9 |
| Hemorrhage/SCM Ratio (MinIP CineMPRAGE) | N/A | 1.7 | 1.8 | 2.1±0.8 |
| Flow artifact/SCM Ratio (MPRAGE) | 1.7 | N/A | 1.3 | 1.7±0.3 |
| Flow artifact/SCM Ratio (MaxIP CineMPRAGE) | 2.4 | N/A | 2.2 | 2.6±0.4 |
| Flow artifact/SCM Ratio (MinIP CineMPRAGE) | 0.6 | N/A | 0.6 | 0.8±0.4 |
Acquired with a 16 channel receive coil.
Acquired with a 4 channel receive coil
DISCUSSION
The results presented here demonstrate that the suppression of blood signal in conventional MPRAGE can be inconsistent and in this study this inconsistent suppression resulted in a range of intensities of blood signal from dark to sufficiently bright to mimic hemorrhage. The primary cause of poor blood suppression was the coverage and timing of the non-selective inversion pulse.
With carotid MPRAGE studies, if the heart is entirely inside the MRI scanner effective field of view, there is a low probability that non-inverted blood will reach the imaging volume during the inversion recovery period. However, with larger distances from the carotid bifurcation to the heart, the heart may not be entirely within the MRI scanner effective field of view since the bifurcation is normally placed near isocenter in carotid imaging. As a result, blood in the heart may not experience some (or any) inversion pulses and non-inverted blood will reach the imaging volume during the inversion recovery period. Typical inversion times for MPRAGE hemorrhage imaging vary from about 300 ms to greater than 900 ms and the inversion time of 370 ms used in this work was not uncommon (4, 6, 11–13). For this inversion time, and when the heart is not entirely within the MRI scanner effective field of view, any blood with an average velocity greater than 68 cm/s during the inversion recovery period would not be inverted when it reached the imaging volume. This average velocity would be lower for the longer inversion times employed in other studies (6, 11, 12). This is clinically significant since peak systolic blood velocity in the common carotid artery frequently exceeds 80 cm/s (23–25).
Although the imaging volume could be moved from isocenter to ensure the heart is entirely within the MRI scanner effective field of view, this can cause image degradation due to gradient non-linearity and increasing magnet field inhomogeneity at large distances from isocenter. In addition, when MPRAGE is applied to the head region, it may not be a possibility to have the entire heart and the imaging volume both inside the MRI scanner effective field of view. In these cases, when the entire heart is not within the MRI scanner effective field of view, the amount of non-inverted blood in the imaging volume is strongly correlated with blood velocity and with the timing of the inversion pulse in the cardiac cycle.
Our results confirmed this velocity dependence of flow suppression (Fig. 2) using a flow phantom. When the heart is not entirely within the MRI scanner effective field of view, the number of inversion pulses experienced by slow flowing blood is velocity dependent. Consequently, the optimal inversion time for blood suppression is therefore also velocity dependent. An inversion time that suppresses stationary blood may fail to adequately suppress slow flowing blood (Fig. 3d). There is also a range of intermediate velocities where flowing blood will experience just a single inversion pulse before reaching the imaging volume. Again, an inversion time that suppresses stationary blood may fail to adequately suppress blood flowing at these intermediate velocities (Fig. 3e). If the T1 relaxation time of blood is estimated to be 1500ms, then any inversion time less than one second will result in blood being out of phase with the surrounding tissue. Imaging sequences such as slab-selective phase-sensitive inversion-recovery (SPI) take advantage of this phase difference to better discriminate between blood flow artifact and hemorrhage (13, 26). When the velocity of blood is above a critical velocity, blood flowing into the imaging volume will not be inverted at all. As with the previous cases, an inversion time optimized to suppress stationary blood will fail to suppress this high velocity blood (Fig. 3f).
Unfortunately, when a patient’s heart is not entirely within the MRI scanner effective field of view, the random timing of the MPRAGE inversion pulse in the cardiac cycle can lead to all three of the scenarios described above. If the inversion pulse occurs just before systole, placing the time of maximum blood velocity in the inversion recovery time, most of the inverted blood will have already passed through the imaging volume during the inversion period. However, if the inversion pulse occurs just before diastole, most of the blood in the image volume will have been inverted. Each case would require a different optimal inversion time for suppression of flowing blood and a single inversion time will result in hemorrhage mimicking flow artifacts (Fig. 4 and 5).
Our preliminary results suggest that these hemorrhage mimicking flow artifacts will be present in a significant portion of MPRAGE studies. A CineMPRAGE reconstruction utilizes the data from a standard non-gated MPRAGE sequence to generate a full sequence of cardiac correlated images throughout the cardiac cycle. This provides a dynamic view of the carotid artery and an increased ability to discern blood signal from potential intraplaque hemorrhage. A CineMPRAGE reconstruction was used to differentiate potential hemorrhage from flow artifact in one of two ways. The first method was to observe the whole dynamic series of images throughout the cardiac cycle. In this case, the signal intensity from potential hemorrhage was constant over the cardiac cycle while any signal from blood flow artifact oscillated over the cardiac cycle. The signal from flowing blood could be accurately identified by considering the dynamics of the signal as seen in Fig. 6. The second method was to consider a flow artifact mask created by comparing the minimum and maximum intensity projections in time through the CineMPRAGE sequence (Fig. 7b and 7c). The difference in signal intensity between the minimum and maximum intensity projections corresponds to the amount of flow artifact A color map corresponding to the CineMPRAGE signal variation was overlaid on the conventional MPRAGE image to help identify flow artifacts (Fig. 7d).
When we consider the 35 patients imaged, the average hemorrhage/SCM ratio was similar between conventional MPRAGE and maximum/minimum CineMPRAGE intensity projections (Table 1). However, when a flow artifact was present (as seen on conventional MPRAGE images), the average flow artifact/SCM ratio was seen to vary significantly between the maximum and minimum intensity projections of the CineMPRAGE reconstruction (Table 1). For example, the minimum and maximum intensity projections were seen to differ significantly for the flow artifact in Fig. 8a while the signal from hemorrhage was relatively unchanged in Fig. 8b and 8c. These results suggest that it is sufficient to observe two projections from the CineMPRAGE reconstruction to better identify hemorrhage mimicking flow artifacts.
The CineMPRAGE reconstruction appears to be robust in the presence of cardiac arrhythmias. For example, the patient in Fig. 8c had a heart rate of 50± 8 beats per minute with very irregular R-R intervals. Ideally, the sampled data should be distributed evenly across each CineMPRAGE cardiac phase. An arrhythmia tends to concentrate the data more toward the first systolic cardiac phases and leaves the later diastolic bins more sparsely filled. The CineMPRAGE data used in Fig. 8c had 12 cardiac phases filled at [18% 18% 20% 20% 20% 18% 18% 18% 18% 18% 9% 5%]. Luckily, the later diastolic cardiac phases tend to have less dynamic information from phase to phase and therefore are more robust to being undersampled (and therefore more temporally blurred) than the earlier and more dynamic systolic phases.
Another benefit of the CineMPRAGE reconstruction is that blurring due to cardiac motion is greatly reduced since data from across the entire cardiac cycle are not averaged into one temporal frame. This has the potential to improve spatial resolution which Kampschulte et al. reported to be one of the two main reasons for misclassification of intraplaque hemorrhage and juxta-luminal hemorrhage/thrombus (27). Novel contrast agents have been proposed for molecular imaging of thrombus (28). Such agents typically shorten the T1 of blood making it more difficult to distinguish blood from hemorrhage and other plaque components. The use of CineMPRAGE to identify flowing blood would be beneficial in these instances. Finally, there is evidence that intraplaque hemorrhage nodes are associated with higher plaque wall stress and increased vulnerability of plaque rupture (29). The dynamic information about hemorrhage available with the CineMPRAGE reconstruction might aid in predicting future neurologic events.
CONCLUSION
While MPRAGE is a successful direct thrombus imaging technique it can suffer from hemorrhage mimicking flow artifacts. This work has shown that retrospectively cardiac correlated CineMPRAGE can be used to identify blood signal and reduce hemorrhage misclassification due to flow artifacts. Even for patients where flow artifacts are not an issue, the CineMPRAGE image reconstruction can provide additional information about carotid dynamics. Since the CineMPRAGE utilizes the same measurement data as the standard non-gated MPRAGE sequence, no additional scan time or sequence modifications are required. The only additional requirements are that the patient’s cardiac information (pressure pulse or ECG) be recorded during the scan and a modest increase in image reconstruction time.
ACKNOWLEDGMENTS
This work has been supported by NIH grants HL48223 and HL57990, Clinical Merit Review Grant from the Veterans Administration Health Care System as well as grants from the Cumming Foundation, the Ben B. and Iris M. Margolis Foundation, and the Mark H. Huntsman Endowed Chair.
APPENDIX A: Flow Pump Construction and Operating Characteristics
A low cost flow pump was constructed to simulate the variable flow in a vessel over the cardiac cycle. The flow is driven by a 7L/min DC brushless water pump (ColdfusionX EWP-3806) which allows variable input voltages up to 12 volts. The water pump voltage is provided by a computer controlled motor controller (Pololu Simple Motor Controller 18v7). This controller has a maximum output voltage of 30 volts and a continuous maximum output current of 7 amps. Custom software written in C++ allows complete control of the shape and power of the voltage waveform supplied to the water pump. This motor controller also allows for reverse polarity which would be useful in mimicking retrograde flow, however, the water pump selected only works in one direction. The voltage to the water pump is monitored with a 555 timer in monostable mode. When a threshold voltage is reached a TTL trigger pulse is produced which can be used as a trigger pulse for MRI sequences. While the water pump is situated near the edge of the patient bed in the scan room, the controller and computer interface are located in a separate control room. Connections between the two are through a RF filtered pass panel.
While the water pump selected is a brushless type, to further reduce any RF noise in the scanner the entire water pump was enclosed in a copper Faraday cage. In house testing has shown a decrease in SNR of about 5% when the flow pump is running. While the input waveform to the water pump can be shaped to any waveform with a 1ms resolution, the actual velocity will be damped due to the system. A sample output velocity profile is shown in Fig. 1b for a square input voltage pulse of 300ms. The total cost of building the pulsatile flow pump was about $100.
REFERENCES
- 1.Takaya N, Yuan C, Chu B, Saam T, Underhill H, Cai J, Tran N, Polissar NL, Isaac C, Ferguson MS, Garden GA, Cramer SC, Maravilla KR, Hashimoto B, Hatsukami TS. Association between carotid plaque characteristics and subsequent ischemic cerebrovascular events: a prospective assessment with MRI--initial results. Stroke. 2006;37:818–823. doi: 10.1161/01.STR.0000204638.91099.91. [DOI] [PubMed] [Google Scholar]
- 2.Parmar JP, Rogers WJ, Mugler JP3, Baskurt E, Altes TA, Nandalur KR, Stukenborg GJ, Phillips CD, Hagspiel KD, Matsumoto AH, Dake MD, Kramer CM. Magnetic resonance imaging of carotid atherosclerotic plaque in clinically suspected acute transient ischemic attack and acute ischemic stroke. Circulation. 2010;122:2031–2038. doi: 10.1161/CIRCULATIONAHA.109.866053. [DOI] [PMC free article] [PubMed] [Google Scholar]
- 3.McNally JS, Kim Choi SE, Yoon HC, Findeiss LK, Roberts JA, Nightingale DR, Narra KK, Parker DL. Correlation of carotid intraplaque hemorrhage with territorial cerebral ischemic events in patients with acute neurologic symptoms. Circ Cardiovasc Imaging. 2011 doi: 10.1161/CIRCIMAGING.111.967398. In Press. [DOI] [PubMed] [Google Scholar]
- 4.Zhu DC, Ferguson MS, DeMarco JK. An optimized 3D inversion recovery prepared fast spoiled gradient recalled sequence for carotid plaque hemorrhage imaging at 3.0 T. Magn Reson Imaging. 2008;26:1360–1366. doi: 10.1016/j.mri.2008.05.002. [DOI] [PubMed] [Google Scholar]
- 5.Mugler JP3, Brookeman JR. Three-dimensional magnetization-prepared rapid gradient-echo imaging (3D MP RAGE) Magn Reson Med. 1990;15:152–157. doi: 10.1002/mrm.1910150117. [DOI] [PubMed] [Google Scholar]
- 6.Moody AR, Murphy RE, Morgan PS, Martel AL, Delay GS, Allder S, MacSweeney ST, Tennant WG, Gladman J, Lowe J, Hunt BJ. Characterization of complicated carotid plaque with magnetic resonance direct thrombus imaging in patients with cerebral ischemia. Circulation. 2003;107:3047–3052. doi: 10.1161/01.CIR.0000074222.61572.44. [DOI] [PubMed] [Google Scholar]
- 7.Bitar R, Moody AR, Leung G, Symons S, Crisp S, Butany J, Rowsell C, Kiss A, Nelson A, Maggisano R. In vivo 3D high-spatial-resolution MR imaging of intraplaque hemorrhage. Radiology. 2008;249:259–267. doi: 10.1148/radiol.2491071517. [DOI] [PubMed] [Google Scholar]
- 8.Ota H, Yarnykh VL, Ferguson MS, Underhill HR, Demarco JK, Zhu DC, Oikawa M, Dong L, Zhao X, Collar A, Hatsukami TS, Yuan C. Carotid intraplaque hemorrhage imaging at 3.0-T MR imaging: comparison of the diagnostic performance of three T1-weighted sequences. Radiology. 2010;254:551–563. doi: 10.1148/radiol.09090535. [DOI] [PMC free article] [PubMed] [Google Scholar]
- 9.Higuchi N, Hiramatsu K, Mulkern RV. A novel method for fat suppression in RARE sequences. Magn Reson Med. 1992;27:107–117. doi: 10.1002/mrm.1910270111. [DOI] [PubMed] [Google Scholar]
- 10.Block W, Pauly J, Kerr A, Nishimura D. Consistent fat suppression with compensated spectral-spatial pulses. Magn Reson Med. 1997;38:198–206. doi: 10.1002/mrm.1910380207. [DOI] [PubMed] [Google Scholar]
- 11.Zhu DC, Vu AT, Ota H, DeMarco JK. An optimized 3D spoiled gradient recalled echo pulse sequence for hemorrhage assessment using inversion recovery and multiple echoes (3D SHINE) for carotid plaque imaging. Magn Reson Med. 2010;64:1341–1351. doi: 10.1002/mrm.22517. [DOI] [PubMed] [Google Scholar]
- 12.Yamada N, Higashi M, Otsubo R, Sakuma T, Oyama N, Tanaka R, Iihara K, Naritomi H, Minematsu K, Naito H. Association between signal hyperintensity on T1-weighted MR imaging of carotid plaques and ipsilateral ischemic events. AJNR Am J Neuroradiol. 2007;28:287–292. [PMC free article] [PubMed] [Google Scholar]
- 13.Wang J, Ferguson MS, Balu N, Yuan C, Hatsukami TS, Börnert P. Improved carotid intraplaque hemorrhage imaging using a slab-selective phase-sensitive inversion-recovery (SPI) sequence. Magn Reson Med. 2010;64:1332–1340. doi: 10.1002/mrm.22539. [DOI] [PubMed] [Google Scholar]
- 14.Singh N, Moody AR, Gladstone DJ, Leung G, Ravikumar R, Zhan J, Maggisano R. Moderate carotid artery stenosis: MR imaging-depicted intraplaque hemorrhage predicts risk of cerebrovascular ischemic events in asymptomatic men. Radiology. 2009;252:502–508. doi: 10.1148/radiol.2522080792. [DOI] [PubMed] [Google Scholar]
- 15.Wang J, Yarnykh VL, Hatsukami T, Chu B, Balu N, Yuan C. Improved suppression of plaque-mimicking artifacts in black-blood carotid atherosclerosis imaging using a multislice motion-sensitized driven-equilibrium (MSDE) turbo spin-echo (TSE) sequence. Magn Reson Med. 2007;58:973–981. doi: 10.1002/mrm.21385. [DOI] [PubMed] [Google Scholar]
- 16.Steinman DA, Rutt BK. On the nature and reduction of plaque-mimicking flow artifacts in black blood MRI of the carotid bifurcation. Magn Reson Med. 1998;39:635–641. doi: 10.1002/mrm.1910390417. [DOI] [PubMed] [Google Scholar]
- 17.Mendes J, Parker DL, Hulet J, Treiman GS, Kim S. CINE turbo spin echo imaging. Magn Reson Med. 2011;66:1286–1292. doi: 10.1002/mrm.22909. [DOI] [PMC free article] [PubMed] [Google Scholar]
- 18.Candes EJ, Li X, Ma Y, Wright J. Robust Principal Component Analysis? JACM. 2009;58:1–37. [Google Scholar]
- 19.Lin Z, Chen M, Wu L, Ma Y. The augmented lagrange multiplier method for exact recovery of corrupted low-rank matrices. University of Illinois at Urbana-Champaign; 2009. Technical Report:UILU-ENG-09-2215. [Google Scholar]
- 20.Tate Q, Bell LC, Kim SE, Minalga E, Parker DL, Hadley JR. Proceedings of the International Society for Magnetic Resonance in Medicine. Stockholm, Sweden: 2010. A 16 Channel Radio Frequency Anterior Neck Coil for Imaging of the Cervical Carotid Bifurcation; p. 3841. [Google Scholar]
- 21.Hadley JR, Roberts JA, Goodrich KC, Buswell HR, Parker DL. Relative RF coil performance in carotid imaging. Magn Reson Imaging. 2005;23:629–639. doi: 10.1016/j.mri.2005.04.009. [DOI] [PubMed] [Google Scholar]
- 22.Stanisz GJ, Odrobina EE, Pun J, Escaravage M, Graham SJ, Bronskill MJ, Henkelman RM. T1, T2 relaxation and magnetization transfer in tissue at 3T. Magn Reson Med. 2005;54:507–512. doi: 10.1002/mrm.20605. [DOI] [PubMed] [Google Scholar]
- 23.Blackshear WM, Phillips DJ, Chikos PM, Harley JD, Thiele BL, Strandness DEJ. Carotid artery velocity patterns in normal and stenotic vessels. Stroke. 1980;11:67–71. doi: 10.1161/01.str.11.1.67. [DOI] [PubMed] [Google Scholar]
- 24.Kamenskiy AV, Dzenis YA, Mactaggart JN, Desyatova AS, Pipinos II. In vivo three-dimensional blood velocity profile shapes in the human common, internal, and external carotid arteries. J Vasc Surg. 2011;54:1011–1020. doi: 10.1016/j.jvs.2011.03.254. [DOI] [PubMed] [Google Scholar]
- 25.Lee VS, Hertzberg BS, Workman MJ, Smith TP, Kliewer MA, DeLong DM, Carroll BA. Variability of Doppler US measurements along the common carotid artery: effects on estimates of internal carotid arterial stenosis in patients with angiographically proved disease. Radiology. 2000;214:387–392. doi: 10.1148/radiology.214.2.r00fe25387. [DOI] [PubMed] [Google Scholar]
- 26.Kellman P, Arai AE, McVeigh ER, Aletras AH. Phase-sensitive inversion recovery for detecting myocardial infarction using gadolinium-delayed hyperenhancement. Magn Reson Med. 2002;47:372–383. doi: 10.1002/mrm.10051. [DOI] [PMC free article] [PubMed] [Google Scholar]
- 27.Kampschulte A, Ferguson MS, Kerwin WS, Polissar NL, Chu B, Saam T, Hatsukami TS, Yuan C. Differentiation of intraplaque versus juxtaluminal hemorrhage/thrombus in advanced human carotid atherosclerotic lesions by in vivo magnetic resonance imaging. Circulation. 2004;110:3239–3244. doi: 10.1161/01.CIR.0000147287.23741.9A. [DOI] [PubMed] [Google Scholar]
- 28.Flacke S, Fischer S, Scott MJ, Fuhrhop RJ, Allen JS, McLean M, Winter P, Sicard GA, Gaffney PJ, Wickline SA, Lanza GM. Novel MRI contrast agent for molecular imaging of fibrin: implications for detecting vulnerable plaques. Circulation. 2001;104:1280–1285. doi: 10.1161/hc3601.094303. [DOI] [PubMed] [Google Scholar]
- 29.Huang X, Teng Z, Canton G, Ferguson M, Yuan C, Tang D. Intraplaque hemorrhage is associated with higher structural stresses in human atherosclerotic plaques: an in vivo MRI-based 3D fluid-structure interaction study. Biomed Eng Online. 2010;9:86. doi: 10.1186/1475-925X-9-86. [DOI] [PMC free article] [PubMed] [Google Scholar]


