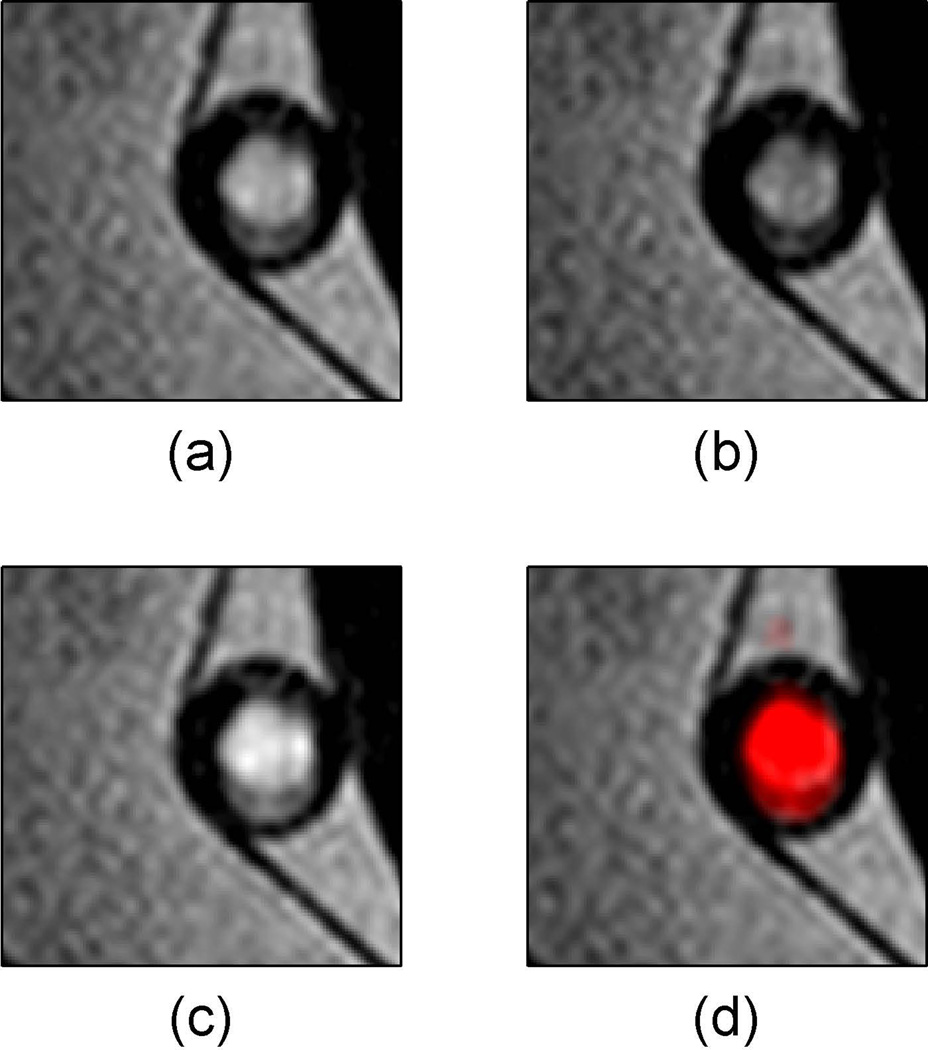
Figure 7.
Identification of flow artifact using minimum and maximum intensity projections with CineMPRAGE. The described MPRAGE sequence failed to suppress flowing water in a pulsatile flow pump (a). The minimum and maximum intensity projections along the temporal direction of the CineMPRAGE reconstruction are shown in (b) and (c) respectively. A color map corresponding to the CineMPRAGE signal variation is overlaid on the conventional MPRAGE image in (d).

