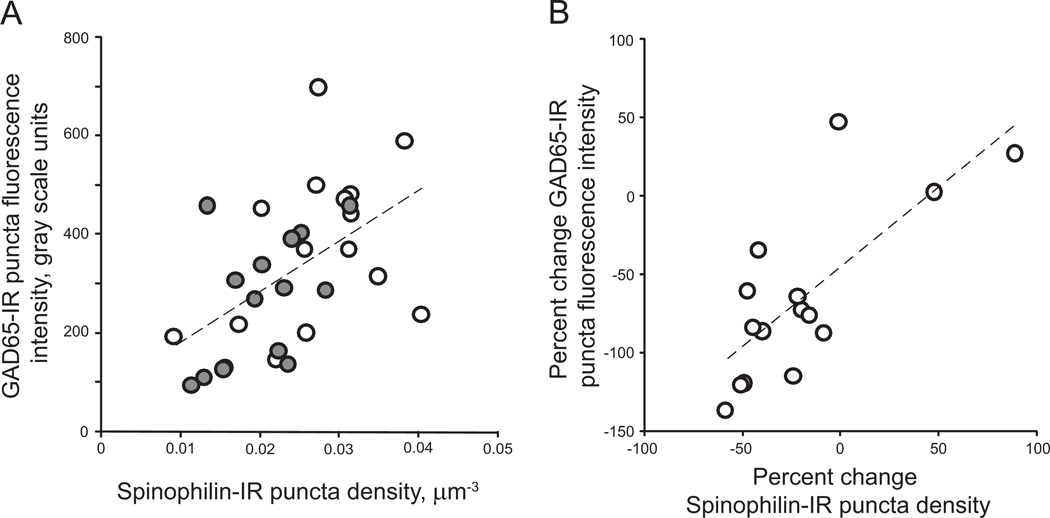
Figure 5.
Correlations between mean and percent change in glutamate decarboxylase 65-immunoreactive (GAD65-IR) puncta fluorescence intensity and spine density in primary auditory cortex. (A) Mean GAD65-IR puncta fluorescence plotted as a function of spinophilin-immunoreactive (IR) puncta density for each subject in cohort 1. Open circles = control subject, filled circles = schizophrenia subject. Dashed line represents the regression line. (Pearson r = .525, p = .003). (B) The percent change in GAD65-IR puncta mean fluorescence intensity plotted as a function of the percent change in spinophilin-IR puncta density for pairs in cohort 1 (schizophrenia subjects relative to matched control subjects). Dashed line represents the regression line. (Pearson r = .745, p = .001).

