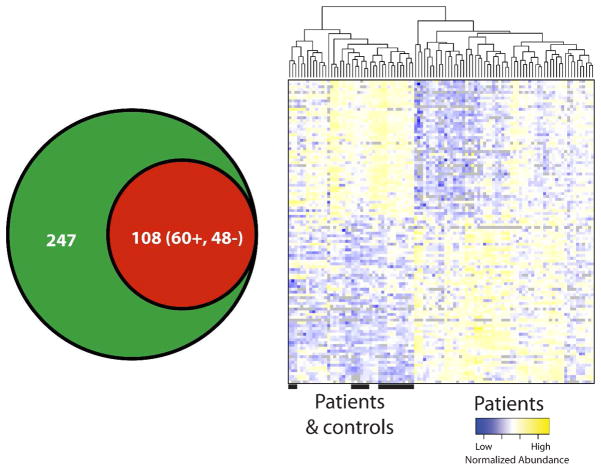
Figure 4.
Analysis of individual patient samples led to the quantification of 247 proteins. An analysis of variance of the protein abundances revealed 108 proteins as being differentially abundant (p value < 0.05) (A) where 60 were increased and 48 were decreased in abundance relative to control. Unsupervised cluster analysis of the subject samples shows that the quantified protein abundances (rows in matrix) allowed for partial segregation of patient and control samples (columns) (B).

