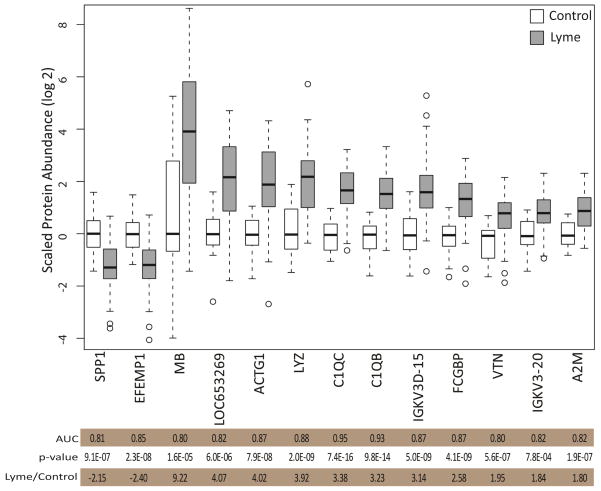
Figure 6.
Proteins with greatest discriminating power for Lyme disease. ROC curve analysis of all proteins identified and quantified in the CSF led to the identification of 13 proteins that had good discriminating power with areas under the curve (AUC) greater than 0.8. Shown are the scaled protein abundance values of the 13 proteins that show the greatest discriminating power in the ROC curve analysis.

