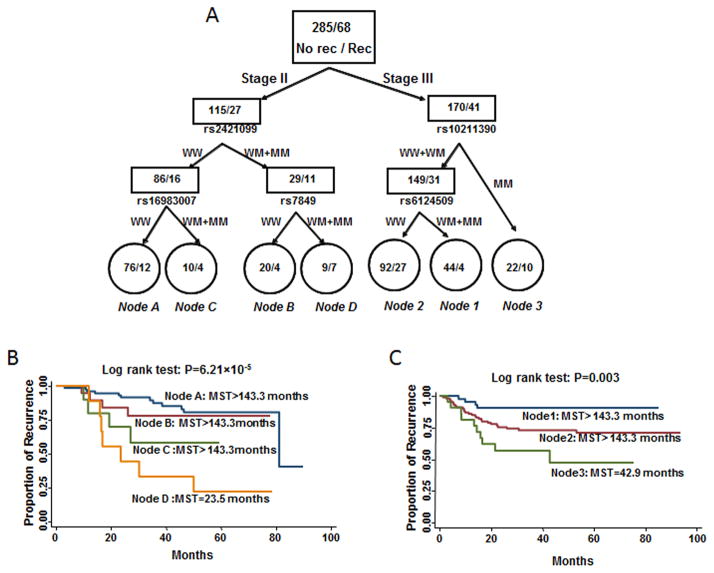
Figure 2.
Potential SNP-SNP interactions. a) Tree structure identifying subgroups of patients with different genetic backgrounds. Kaplan–Meier curves for recurrence-free survival based on survival-tree analysis in patients with b) stage-II or c) stage-III disease; MST: median recurrence-free survival time.

