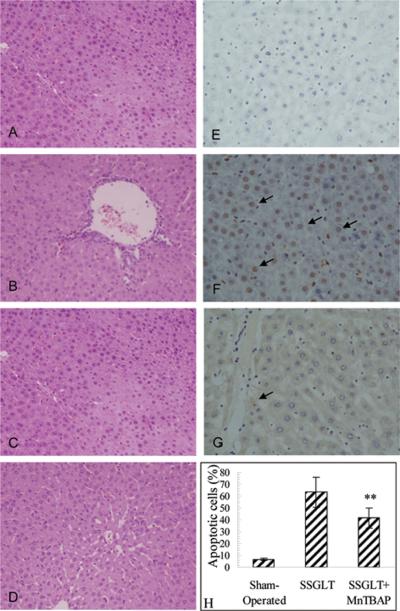
FIGURE 2.
Representative micrographs of liver histology after SSGLT with or without MnTBAP treatment. A–D: Hematoxylin and eosin (H–E) staining for small size liver graft sections at different time points after transplantation: A. 24 hrs after transplantation, B. 3 days after transplantation, C. 5 days after transplantation. D. 3 days after transplantation with MnTBAP treatment. E–G. Representative micrographs of in situ TUNEL staining of apoptotic cells in small size grafts. Each section was examined for 10 high-power fields, and both apoptotic and all cells were counted, and apoptotic cell count was expressed as follows: Apoptotic cell count (%) = (Apoptotic cells/total cell count) × 100. H. E. Sham-operated control. F. Small size graft at 30% volume 72 hours after transplantation. G. Small size graft at 30% volume from recipient rats with MnTBAP treatment. 400×. Average apoptotic cell count (%) in each group 3 days after transplantation. ** p<0.01 compared to SSGLT. n=6 in each group.

