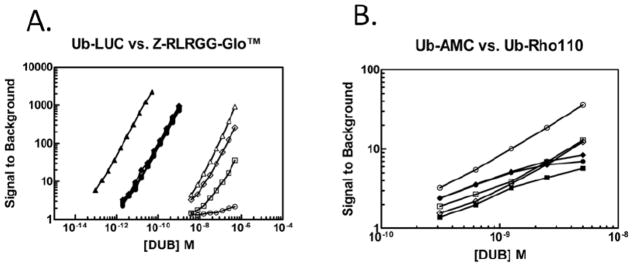
Figure 3. Determination of assay dynamic range for various DUB substrates.
Panel A: Indicated concentrations of UCHL3 (▲/△), USP2core (◆/◇), USP7 (●/○) and USP8 (■/□) were incubated with either 250nM Ub-AML (closed symbols) or 20μM Z-RLRGG-AML (open symbols) for 30min prior to RLU measurement and S/B calculation (see methods). Panel B: Indicated concentrations of USP2core (◆/◇), USP7(●/○), and USP8 (■/□) were incubated with 250nM of either Ub-AMC (closed symbols) or Ub-Rho110 (open symbols) with immediate and continuous monitored fluorescence. S/B values were calculated from 30m time points (see methods). Data are representative of triplicate measurements.

