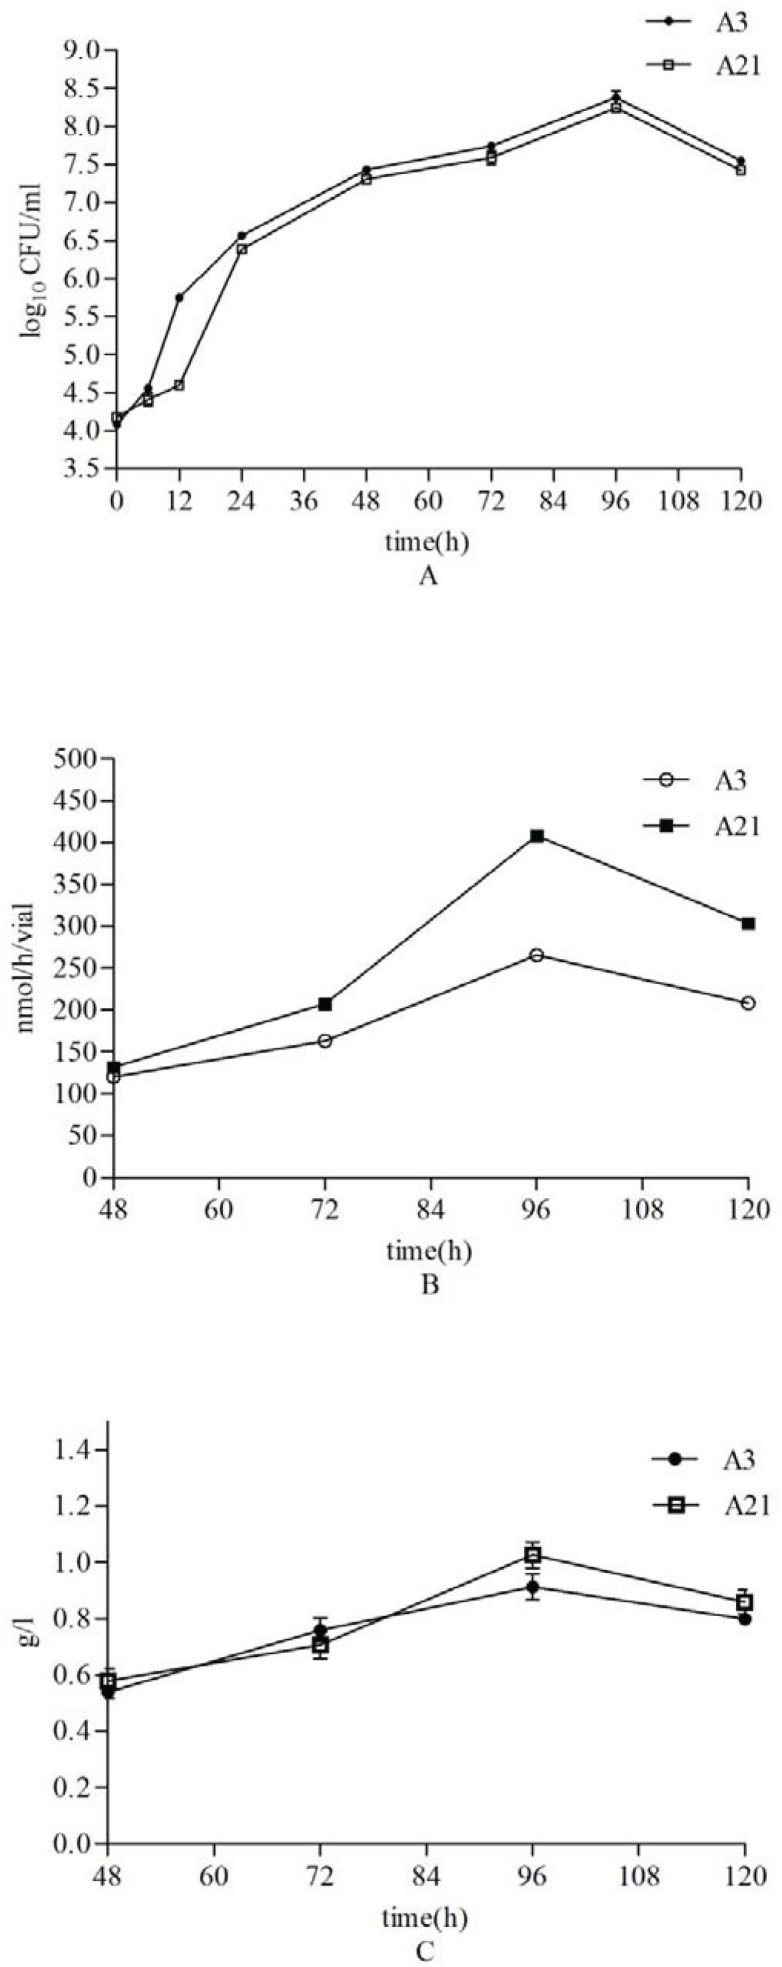
Fig. 5.
The growth curve (Panel A), nitrogen fixation (Panel B) and alginate production (Panel C) by A3 and A21 isolates. Sampling was carried out within 120 h. After 96 h, both strains arrived at stationary phase as well as the maximum levels of alginate production and nitrogen fixation. All data points are the means of three replicates. Standard errors are shown by vertical bars.

