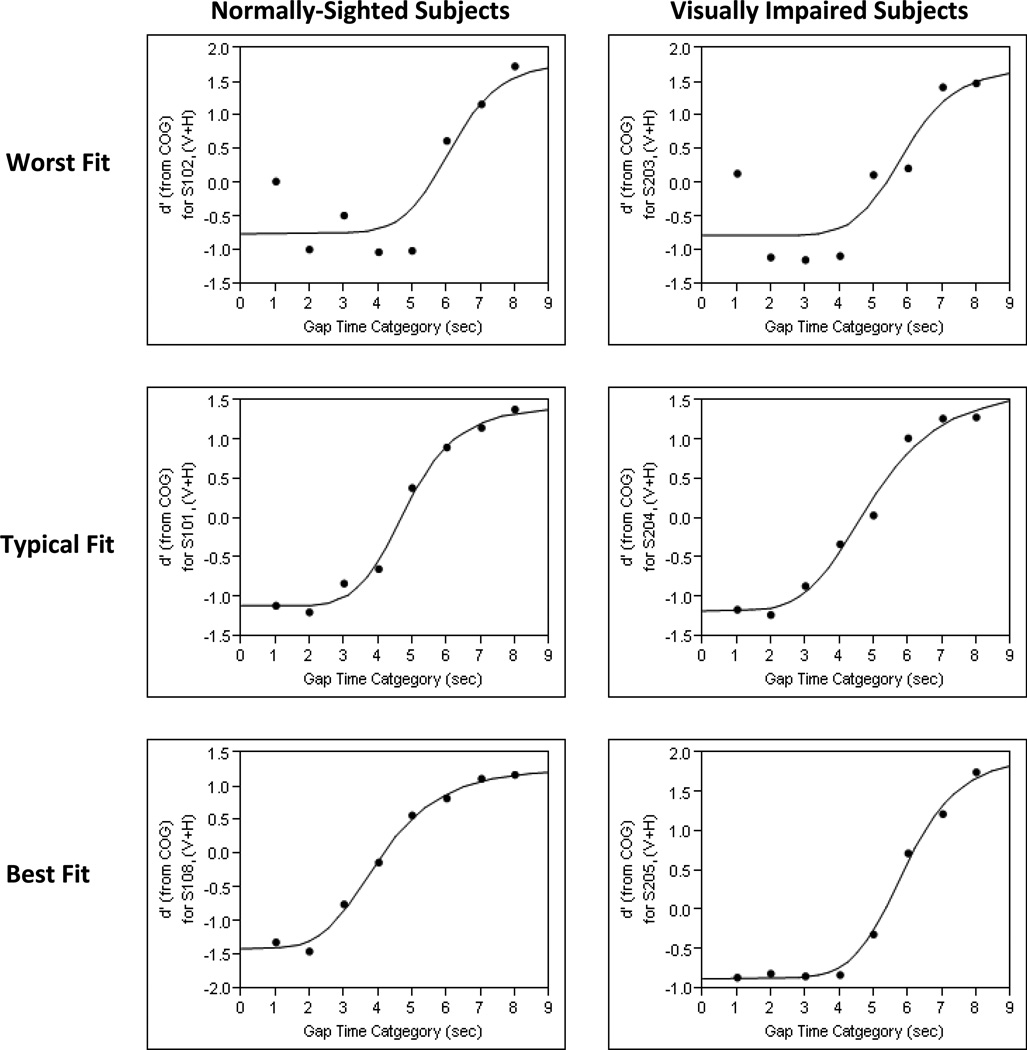
Figure 4. Sample non-linear functions from both subject groups.
d’ (from COG) = mean of each distribution of the decision variable relative to a center of gravity (COG)
(V+H) = sensory modality condition of vision + hearing
S101, S102, and S108 = subject ID codes for 3 normally-sighted subjects
S203, S204, and S205 = subject ID codes for 3 visually-impaired subjects

