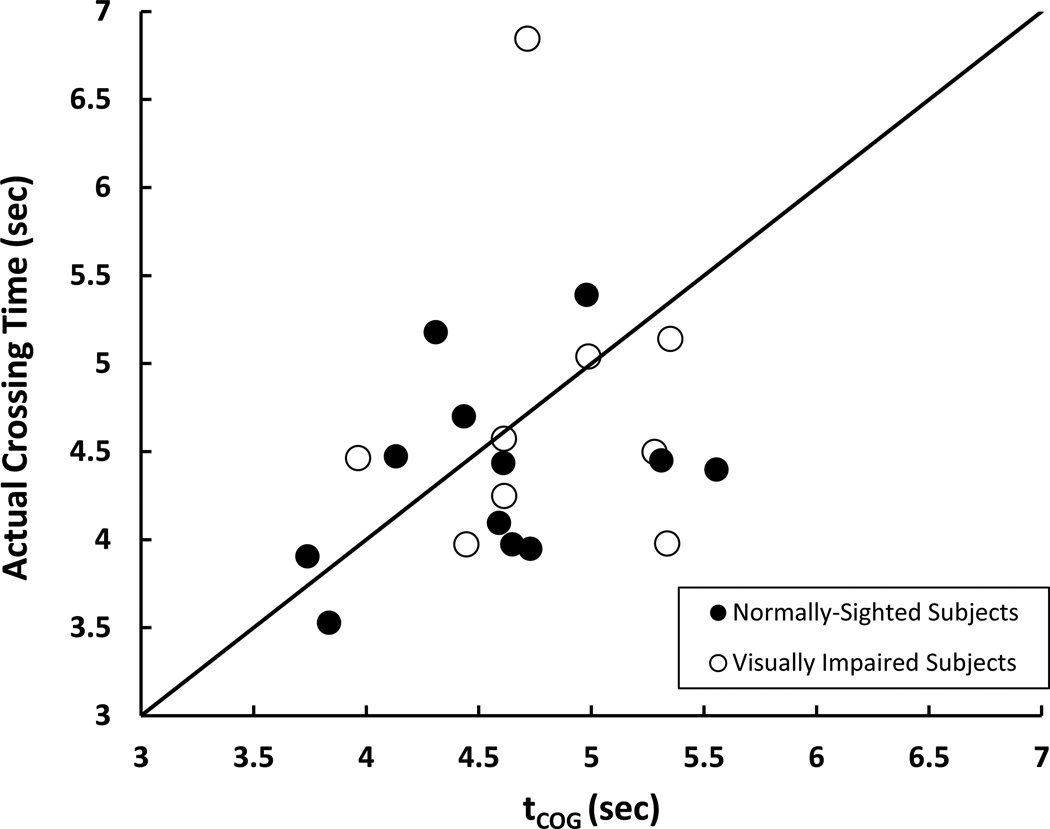
Figure 5. Scatterplot between subjects’ actual crossing time and their tCOG.
tCOG = x-intercept of the non-linear function between the mean of each distribution of the decision variable relative to a center of gravity (COG) (ie. d’ relative to COG) and Gap Time category. The tCOG corresponds to the time (in seconds) at which the subject transitions from classifying gap times as being “not enough time to cross” to being “enough time to cross”.

