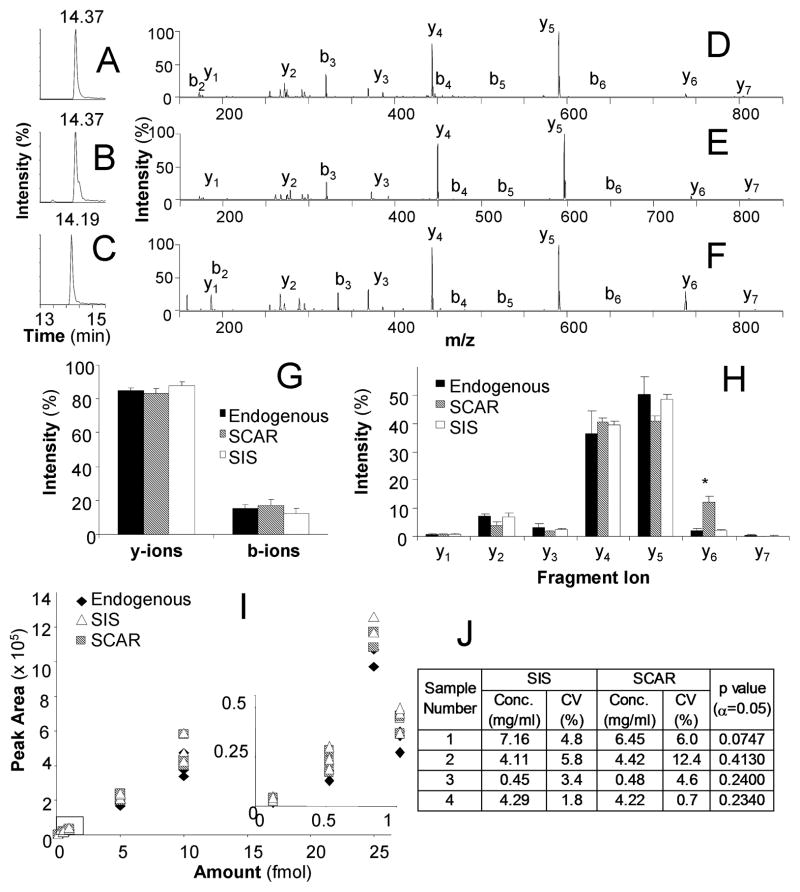
Figure 2. Quantification of Endogenous IgM in Serum using SIS and SCAR Peptides.
LC-MRM total ion chromatograms for the endogenous peptide (A), SIS peptide (B), and SCAR peptide (C). MS/MS data averaged over one minute of acquisition time for the endogenous peptide (D) SIS peptide (E) and SCAR peptide (F). The distribution of charge retention is plotted using b vs. y-ion signal for the three peptides (G), and y-ion data were further analyzed to compare individual transitions. All transitions were similar except for y6 in which the SCAR peptide showed higher intensity and y5 for which the SCAR peptide had lower intensity (H). A dilution series of the peptide set shows similar peak areas for all three peptides, resulting in accurate absolute quantification by each internal standard (I). The expression of IgM was measured by both internal standards in serum samples from 4 multiple myeloma patients; no difference was found between the results calculated using the SIS and SCAR peptides (J).

