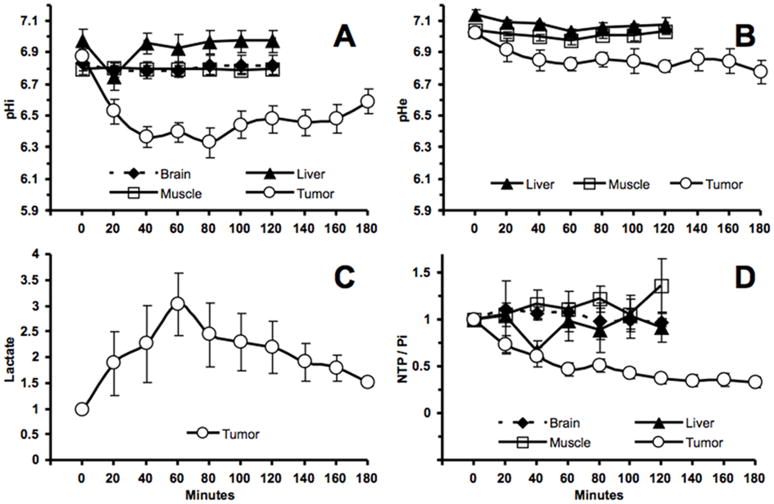
Figure 2.
(A). The intracellular pH (pHi) profile as a function of time of human melanoma xenografts (n = 15) and normal tissues [skeletal muscle (n = 6), liver (n = 6), and brain (n = 3)] in response to LND (100 mg/kg; i.p.) administration at time zero. (B). The extracellular pH (pHe) profile as a function of time of human melanoma xenografts (n = 4) and normal tissues [skeletal muscle (n = 3) and liver (n = 3),] in response to LND (100 mg/kg; i.p.) administration at time zero. (C). Change in tumor lactate as a function of time after administration of LND (100 mg/kg). Area under the curve was compared to baseline at each time points and was normalized to baseline levels. (D). The changes of NTP/Pi (ratio of peak area) relative to baseline as a function of time of human melanoma xenografts (n=15) and normal tissues [skeletal muscle (n = 6), liver (n = 6), and brain (n = 3)] in response to LND (100 mg/kg; i.p.) administration at time zero. The values are presented as mean ± S.E.M. When not displayed, S.E.M. values were smaller than the symbol size.

