
Fig. 5.
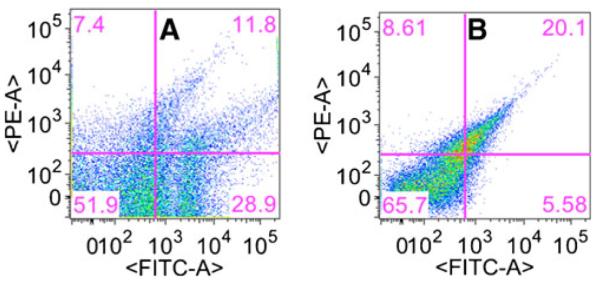
Detection of the conjugational gene transfer by flow cytometry equipped with florescent activated cell sorting (FACS). Dot plots of green fluorescence (GFP-H) versus red fluorescence (PE-H) under the presence of kanamycin at concentrations of 2.5 (a) and 0 (b)μg/ml. Regions defining four populations (D, T, R, and S) were set according to size scatter and relative green and red fluorescence. Red region plasmid segregational lost cells, green region transconjugant cells, yellow region dual labeling donor cells, none-fluorescent region recipient cells. Biofilms of recipient cells (P. putida KT2442) were formed in flow cells for 3 days, and then donor cells (P. putida TUM-PP12 with TOL-gfpmut3b plasmid, yellow) were introduced into the flow chambers and continuously cultivated for additional 5 days