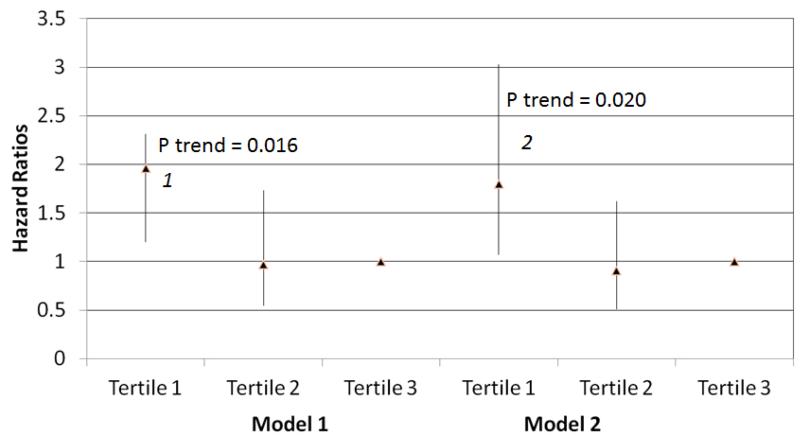
Figure 1. Adjusted Association of baseline calf muscle density with all-cause mortality in participants with peripheral arterial disease (N=434).
Model 1. Adjusted for age, sex, and race.
Model 2. Adjusted for covariates in Model 1 and the ankle brachial index, body mass index, comorbidities, physical activity, smoking history and study cohort (WALCS vs. WALCS II).
1P=0.008 for the comparison between the highest and lowest tertiles.
2 P=0.028 for the comparison between the highest and lowest tertiles.

