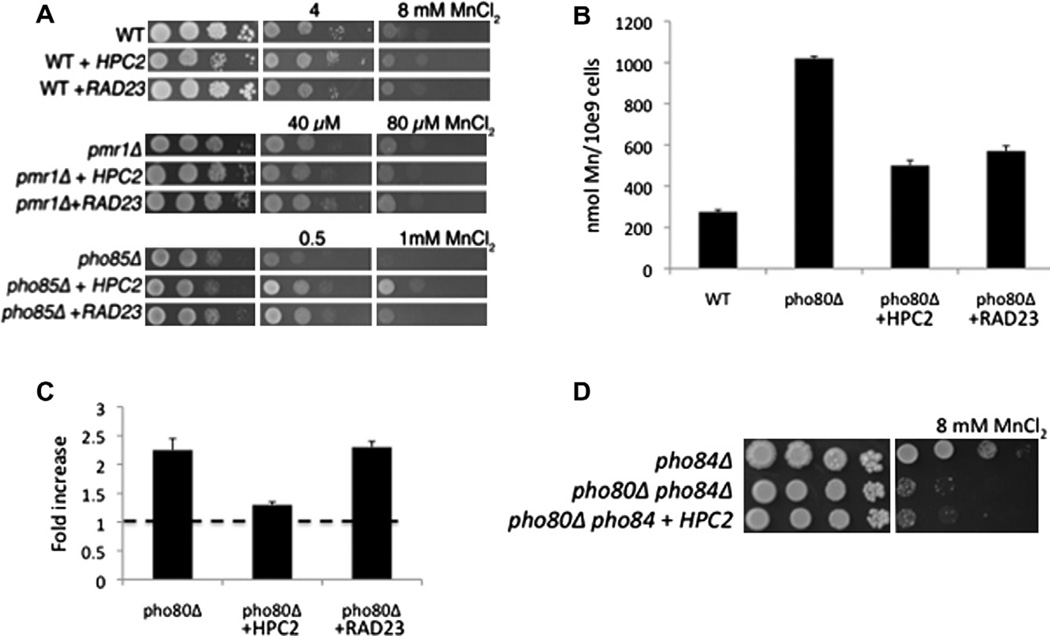
Fig. 2.
HPC2 and RAD23 lower manganese accumulation in pho80 mutants by distinct methods. (A) The indicated strains were tested for manganese toxicity as in Fig. 1A. The different levels of manganese salts represent the differing sensitivities of the parental strains to the metal where WT strains are most resistant and pmr1Δ mutants are most sensitive to manganese toxicity. (B) The indicated strains were tested for whole cell manganese by AAS as described in Section 2. Values are averages of duplicate measurements from two independent cultures and error bars indicate standard deviation. (C) Real time PCR analysis of PHO84 mRNA in the indicated strains was carried out as described in Section 2 and previously published [11]. Fold change represents the increase in PHO84 mRNA over the WT control. Dotted line shows value of 1.0 assigned to WT control. Values are averages of duplicate measurements from three independent cultures; error bars indicate standard deviation. (D) The indicated strains were tested for manganese toxicity as in Fig. 1A. The pho84Δ mutation reverses much of the manganese toxicity of a pho80Δ strain; hence the higher level of manganese used in toxicity testing. Strains used: (A) WT, BY4741; pmr1Δ and pho85Δ are KanMX4 deletion derivatives of BY4741; (B and C) as described in Fig. 1; (D) pho84Δ, LR122; pho80Δ pho84Δ, LR154. The indicated plasmids for expressing HPC2 and RAD23 are as described in Fig. 1.

