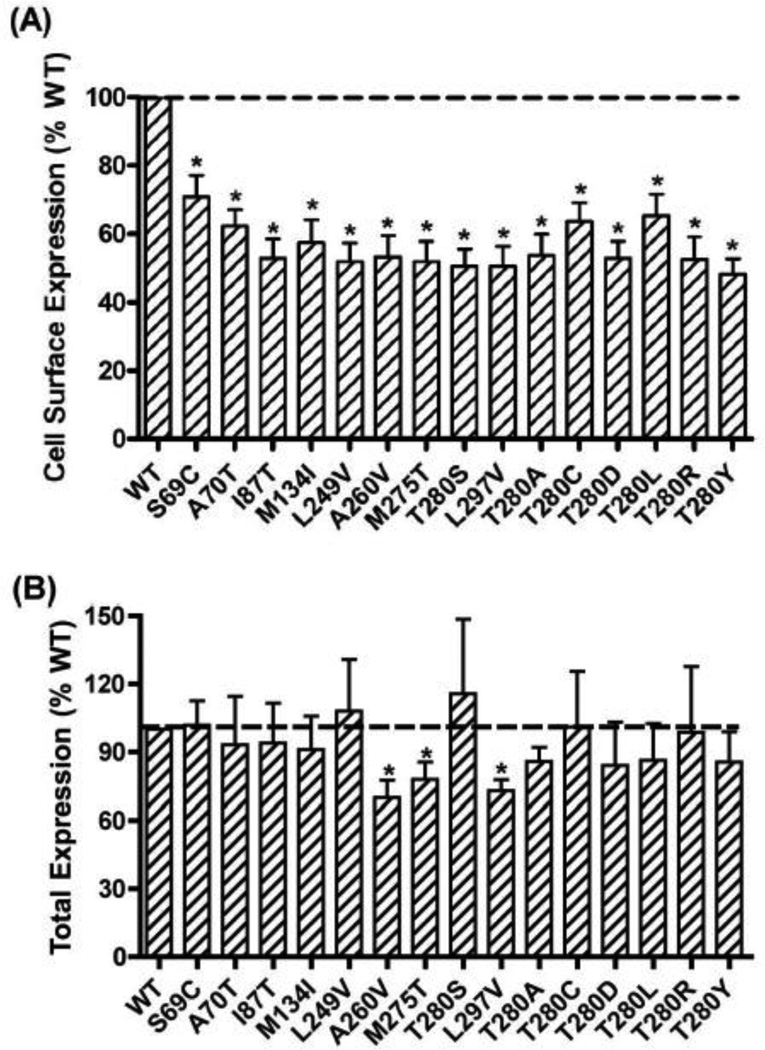
Figure 8.
Quantitative measurement of cell surface (A) or total (B) expression of WT and mutant hMC3Rs by flow cytometry. In (A), cell surface expression of the WT and mutant hMC3Rs were measured by flow cytometry. The results were expressed as % of WT cell surface expression levels after correction of the nonspecific staining in cells transiently transfected with the empty vector as described in Materials and Methods. Data were mean ± SEM of 8–9 experiments. Star (*) indicates significantly different from WT hMC3R. In (B), total expression of the WT and mutant hMC3R were measured by flow cytometry. The results were expressed as % of WT total expression levels after correction of the nonspecific staining in cells transiently transfected with the empty vector as described in Materials and Methods. Data were mean ± SEM of 6–7 experiments. Star (*) indicates significantly different from WT hMC3R.

