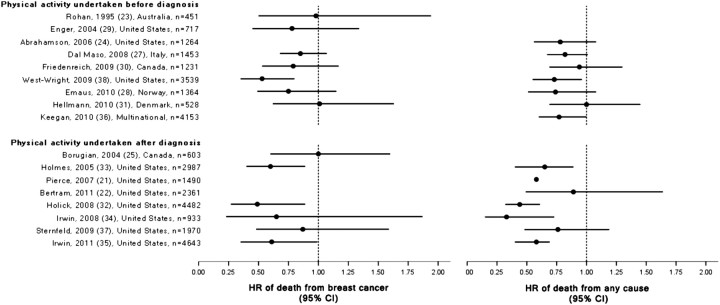
Figure 2.
Forest plot of risk estimates from observational studies of physical activity and mortality outcomes in breast cancer survivors. Black circles indicate hazard ratios (HRs), and solid horizontal lines represent 95% confidence intervals (CIs). The vertical dotted line indicates point of unity.

