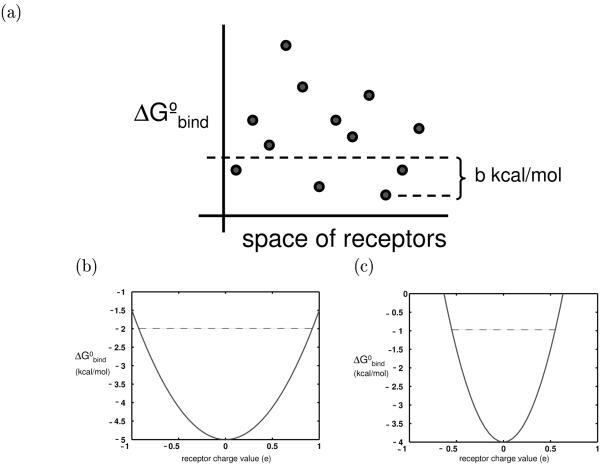
Figure 1.
(a) Graphical representation of the promiscuity metric; the ligand represented here has a promiscuity of 4. (b), (c) The binding profiles of two hypothetical ligands toward an infinite panel of identically-shaped receptors, using a continuum electrostics framework. for ease of visualization, the receptors have only one charged atom so that a ligand’s binding profile is a function of only one value. The profile shown in (b) represents a more promiscuous ligand that that shown in (c). The dotted line in each indicates the possible receptors that can contribute to each ligand’s promiscuity, using a 3 kcal/mol threshold, Π3.

