
Figure 10.
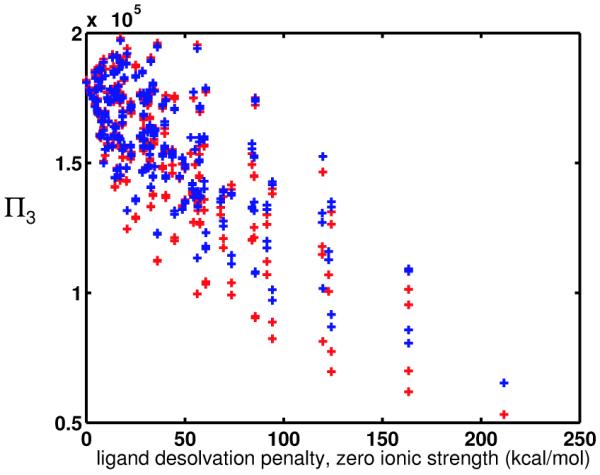
The π3 values for ligands plotted against ligand desolvation free energy. Here, the receptor set consists of 144 different shapes and an “unbounded” charge space for each shape. Systems with ionic strengths of 0.0 M (red) and 0.145 M (blue) are plotted. For ease of comparison, the desolvation energy plotted for both systems is the desolvation energy in an ionic strength of 0.0 M.