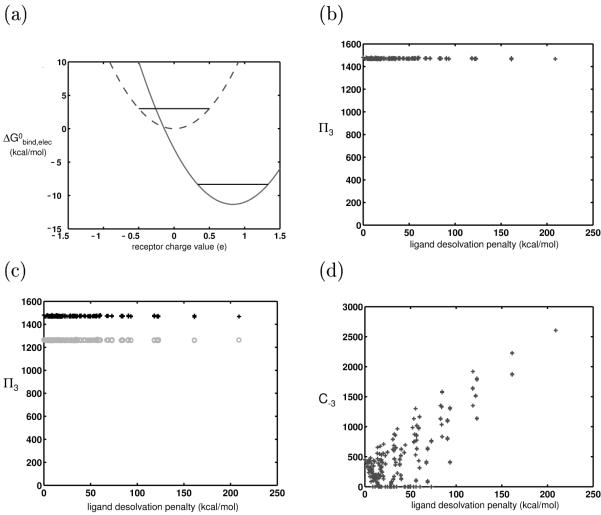
Figure 3.
Theory and results for the control system: (a) Binding free energy profiles for two hypothetical ligands differing in charge and binding in fixed orientation to identically-shaped receptors. Though these ligand have different absolute affinities to the panel of receptors, they have identical promiscuities (π3), as shown by the black horizontal lines. This plot shows the hypothetical electrostatic binding affinity, but as the shapes of all receptors and complexes are identical, the van der Waals and SASA contributions will not contribute toward promiscuity. (b) Plot of promiscuity vs. ligand hydrophilicity (as measured by desolvation penalty) for 625 simulated ligands varying only in charge and binding to simulated receptors meant to recreate the space described in (a). (c) The results in (b) (black + ’s) are compared to ones in which the two receptor rods marked with a ‘*’ in Fig. 2 were translated 0.3 Å closer to the ligand, thus increasing receptor desolvation by the ligand (gray o’s). As the R matrix for this new system has larger elements, the ligands are all more specific toward their panel of receptors. (d) Ligand coverage (C−3) is plotted against its desolvation penalty. In this control system, highly charged and polar ligands are able to bind to many receptors with high affinity, when compared to hydrophobic ligands. Chapter 3 provides the theoretical framework for understanding why this is the case in this system.

