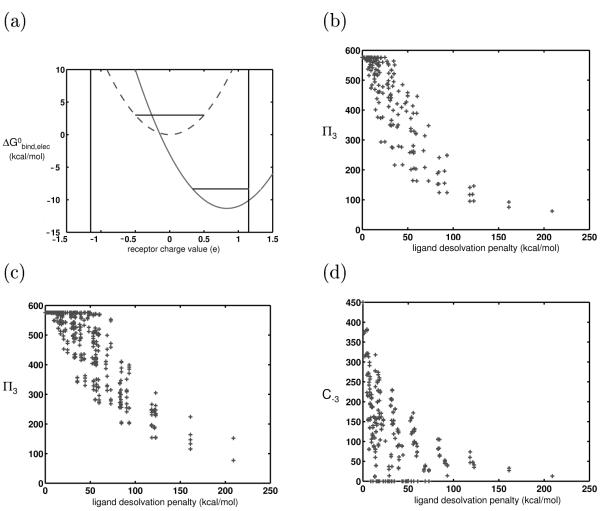
Figure 5.
Effect of adding bounds to receptor charge space. (a) The vertical lines represent bounds that lower the number of competing receptors for a highly charged/polar ligand (represented by solid-line parabola) more than it does for an uncharged ligand (represented by dashedline parabola). Therefore, polar/charged ligands are less promiscuous in a symmetrically bounded space. (b) Numerical experiment showing the promiscuities of model ligands varying only in charge and rigidly binding to identically-shaped model receptors in a bounded charge space. (c) Same as (b), except the receptor charge space at the two basis points is sampled from the distribution shown in Figure 4b. (d) C−3, values are plotted against ligand desolvation penalty. The receptor panel used was the same as that used to generate the results shown in (b). Now that the receptor charge space is bounded, the charged and polar receptors are able to bind to few receptors with high affinity, unlike those analyzed in Figure 3d.

