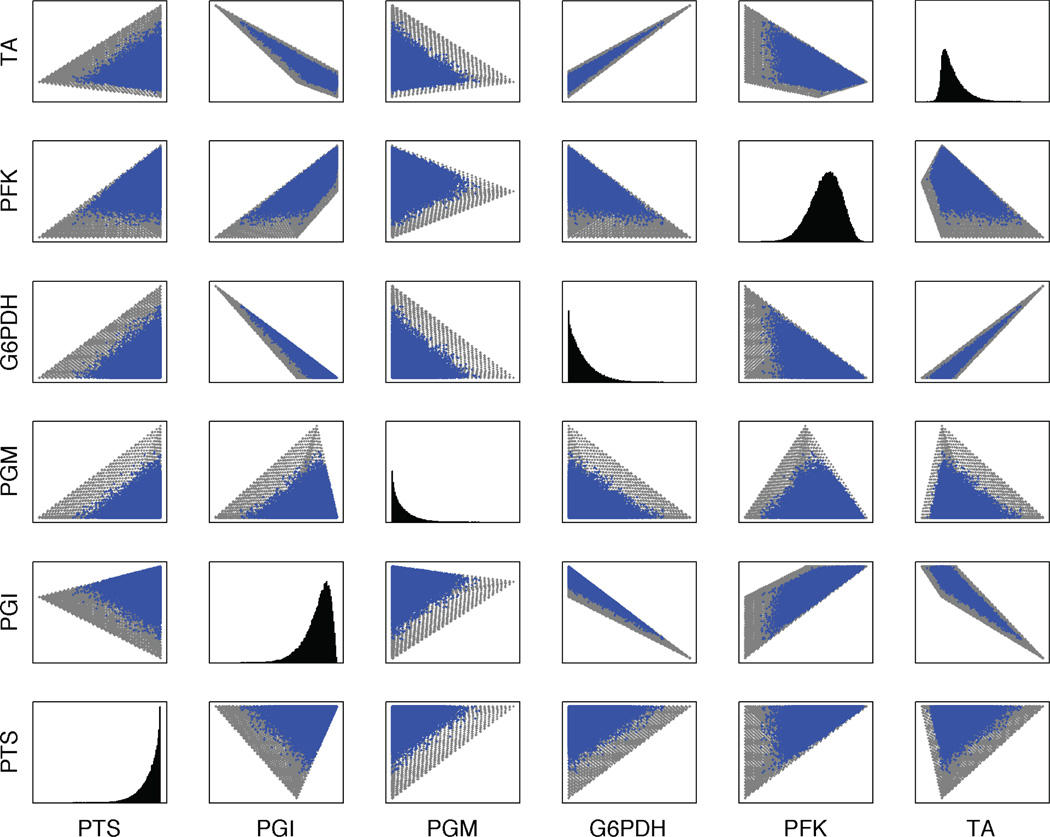
Figure 2.
Pairwise projection of the sampling of the constraint-based solution space using the hit-and-run sampler (blue) and the geometric sampler (gray). The diagonal shows the probability distribution for each reaction relative to the hit-and-run sampling. Only the first six reactions are shown. The complete data are in Supplementary material. Note that the gray points are plotted underneath the blue ones, and that the geometric sampler delineates all of the space covered by the hit-and-run sampler, plus the additional spaces seen here.

