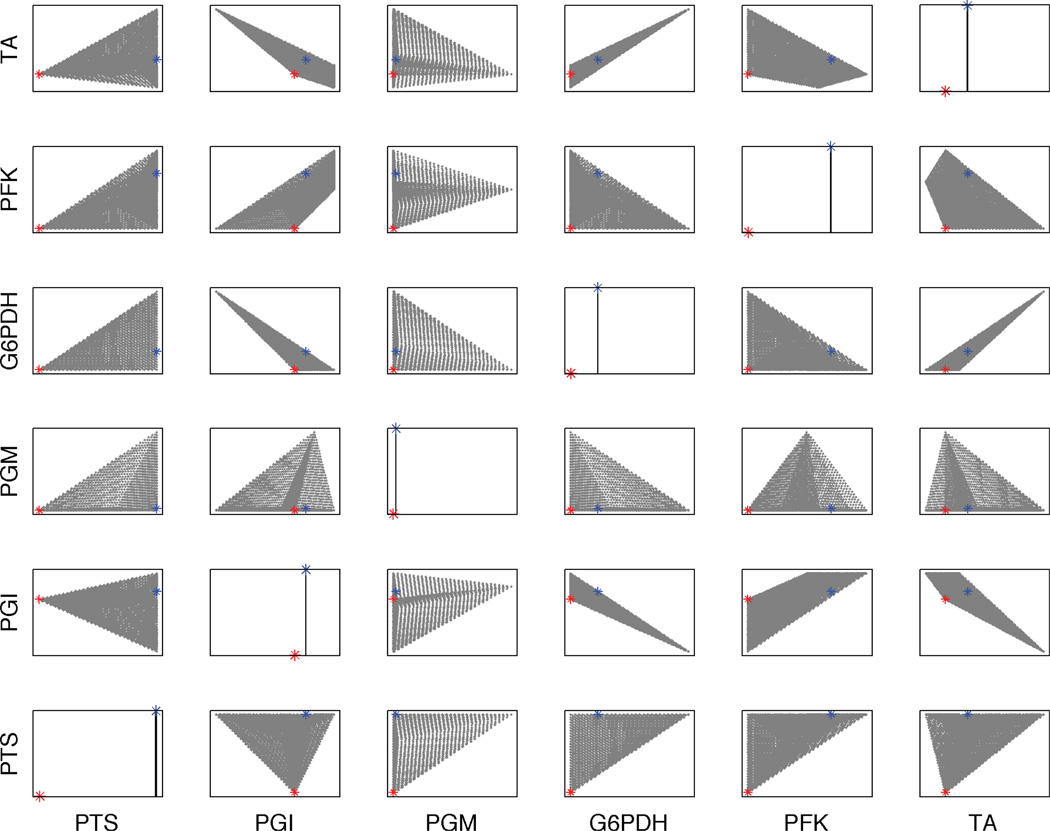
Figure 3.
Pairwise projection of the sampling of the solution space obtained for the dynamic model by sampling the initial metabolite concentrations, overlapping the complete solution space (gray) for better visualization. The blue dot shows the location of the original steady state. The red dot shows the location of the secondary steady state. Only the first six reactions are shown. The complete data are in Supplementary material. The diagonal gives the relative probabilities of the steady-state flux distribution.

