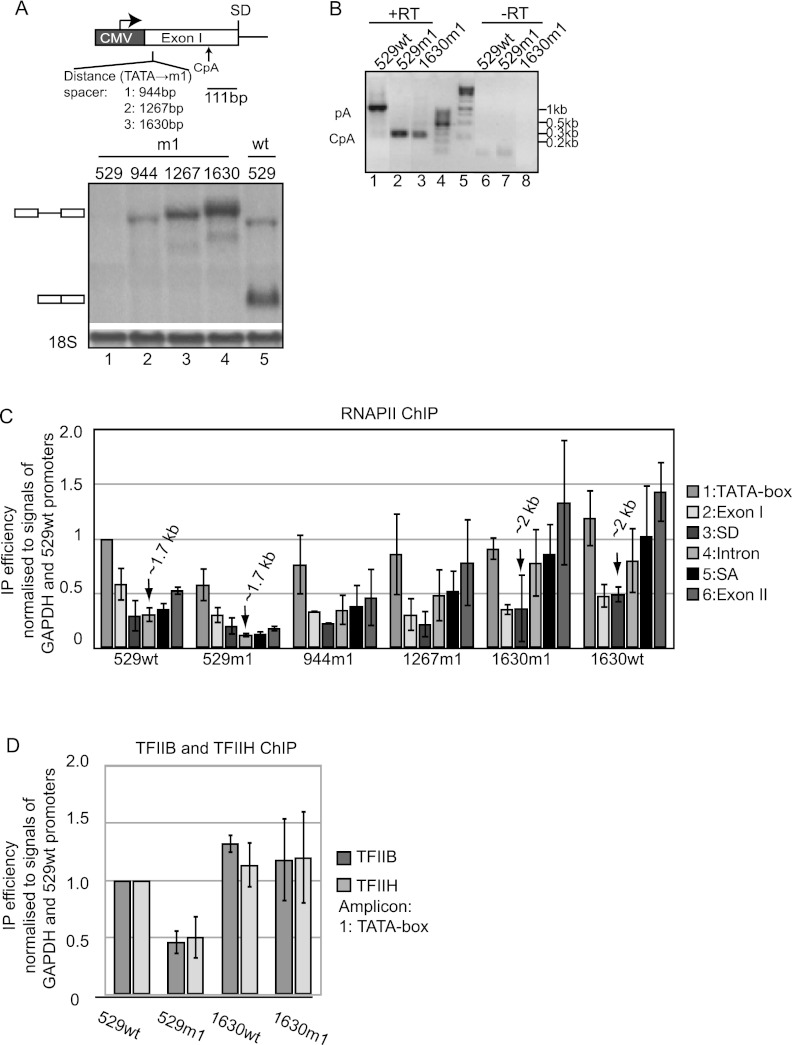
Figure 4.
Promoter-proximal CpA utilization down-regulates transcription. (A, top) Schematic drawing showing the spacer insertion site relative to the CpA position. (Bottom) Northern blotting analysis of total RNA harvested from indicated cells Tet-induced for 24 h. The loading control and gel annotation are as in Figure 2E. (B) 3′ RACE seminested RT–PCR on total RNA samples from the 529wt, 529m1, and 1630m1 cell lines from A analyzed and displayed as in Figure 2C. Sizes estimated from DNA markers in lanes 4 and 5 are indicated at the right. (C) RNAPII ChIP analysis of the indicated loci using conditions and amplicons as in Figure 1D. Data were analyzed and displayed as in Figure 1D. (D) TFIIB and TFIIH CMV promoter ChIP analysis of indicated loci analyzed and displayed as in Figure 1C.

