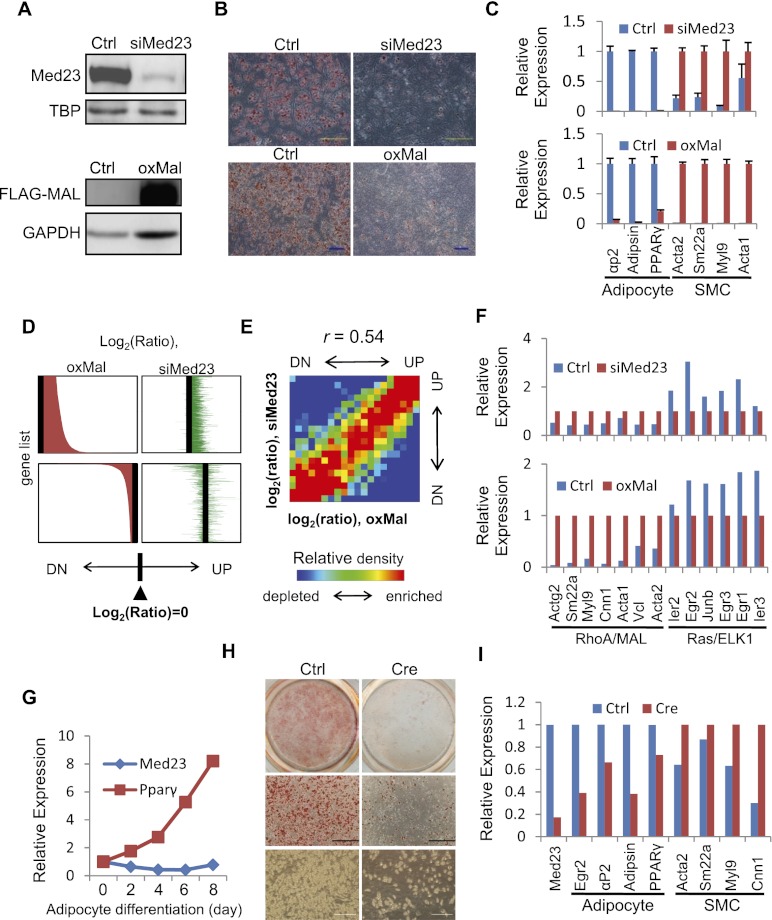
Figure 4.
Analysis of lineage program and gene profiles regulated by MED23 and MAL. (A) Western blot was performed to confirm the siRNA depletion of endogenous MED23 and ectopic Flag-MAL expression in 10T1/2 cells. TBP or GAPDH was blotted as a loading control. (B) Ctrl, siMed23 (top panel), and oxMal (bottom panel) 10T1/2 cells were subjected to the hormone-induced adipocyte differentiation protocol. At day 8 post-induction, the cells were stained for lipid droplets with ORO. Bar, 200 μm. (C) Real-time PCR analysis of adipocyte (PPARγ, αp2, and Adipsin) and SMC (Acta2, Sm22a, Myl9, and Acta1) markers in Ctrl and siMed23 (top panel) or Ctrl and oxMal (bottom panel) 10T1/2 cells at day 8 post-induction. Their expression was normalized to Gapdh. (D) oxMal-affected genes are shown in the left panel (top, up-regulated; bottom, down-regulated) according to the oxMal/Ctrl log2 ratio. The siMed23/Ctrl log2 ratio of the same genes is listed in identical order in the right panel. (E) Gene density map comparing gene expression changes in siMed23/Ctrl with those in oxMal/Ctrl. Genes were distributed in the table according to their expression ratios in the two comparisons. Spearman rank correlation coefficient (r) is indicated. (UP) Up-regulated; (DN) down-regulated. More detail is offered in the Supplemental Material. (F) The expression pattern of known RhoA/MAL and Ras/ELK1 targets was extracted from microarray data. The expression in siMed23 (top panel) or oxMal (bottom panel) 10T1/2 cells was normalized to 1. (G) The mRNA levels of Med23 and PPARγ during adipocyte differentiation were analyzed using real-time PCR. The expression was normalized to 18S. (H) Ctrl ADSCs (Med23fl/fl) and Cre ADSCs (Med23fl/fl ADSCs infected with Cre-expressing adenovirus for 48 h) were subjected to the hormone-induced adipocyte differentiation protocol. At day 8 post-induction, ORO staining and bright-field pictures were taken. Bar, 200 μm. (I) The mRNA levels of Med23, adipocyte markers (Egr2/krox20, PPARγ, αP2, and Adipsin), and SMC markers (Acta2, Sm22a, Myl9, and Cnn1) in Ctrl and Cre ADSCs were analyzed using real-time PCR at day 8 post-induction. The expression levels were normalized to 18S.

