Figure 7.
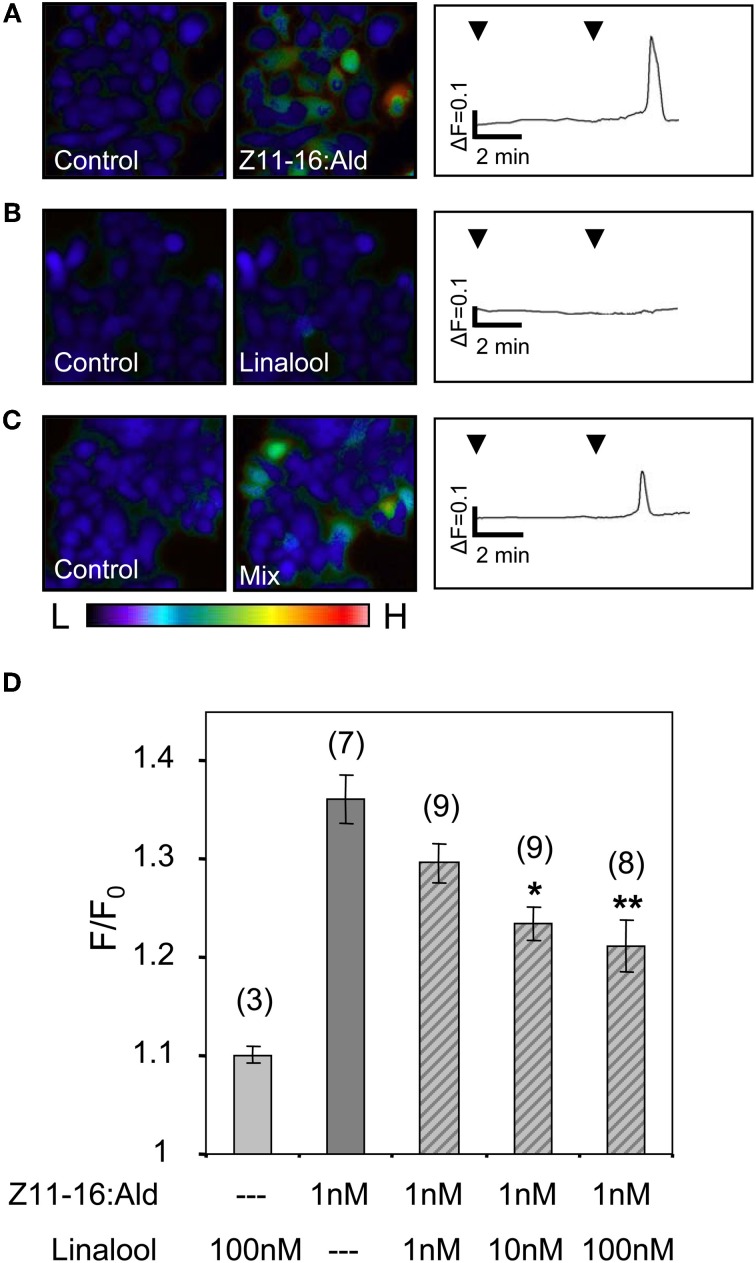
Linalool reduces the responses of HR13-expressing cells to Z11-16:Ald. (A–C) Pseudocolor images on the left indicate calcium levels in HR13-expressing cells after the application of Ringer with 0.1% DMSO, 0.1% n-hexane (control) or stimulation with solutions containing 1 nM Z11-16:Ald (A), 100 nM linalool (B) or a mixture of both (C). The color bar indicates low (L) and high (H) calcium concentration in blue and red, respectively. Calcium responses of representative cells from the experiments are shown to the right as changes of fura-2 fluorescence intensity ratios (340/380 nm) over time. HR13-expressing cells displayed clear calcium responses to Z11-16:Ald (A), whereas these cells did not respond to linalool (B) and showed reduced responses to a mixture (C) of the pheromone component and the plant odorant (ratio 1:100). (D) Responses of HR13-expressing cells to Z11-16:Ald/linalool mixtures at different ratios. Cell responses were monitored after stimulation with solutions containing 1 nM Z11-16:Ald and 1, 10 or 100 nM linalool, respectively. (For comparison, data for linalool and pheromone component alone were adopted from Figure 6.) HR13 cells do not respond to linalool (100 nM) but show a clear calcium signal after stimulation with Z11-16:Ald (1 nM). The pheromone-induced calcium response of the cells is significantly reduced in the presence of a 10- and 100-fold excess of linalool. Bars represent the mean responses of cells reported as F/F0 ± SE ratios determined from 3 to 9 independent replicates with at least 30 cells in each experiment. Values have been normalized to the control. Responses to mixtures, which were significantly decreased compared to the response to the pheromone component alone, are indicated by asterisks (*p < 0.05, **p < 0.01; One-Way ANOVA followed by Dunnett's post-test).

