
Figure 1.
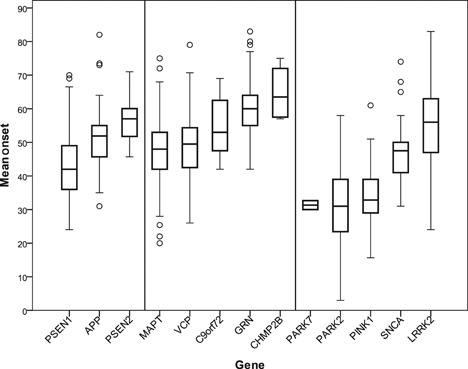
Boxplot showing disease onset age distributions per gene. Family-based average onset ages of established pathogenic variants were used. For PARK7, PARK2, and PINK1, only patients carrying homozygous or compound heterozygous mutations were included in the calculations. Boxes represent the interquartile onset age distribution, horizontal lines indicate medians, whiskers show standard deviations, and circles indicate outliers.