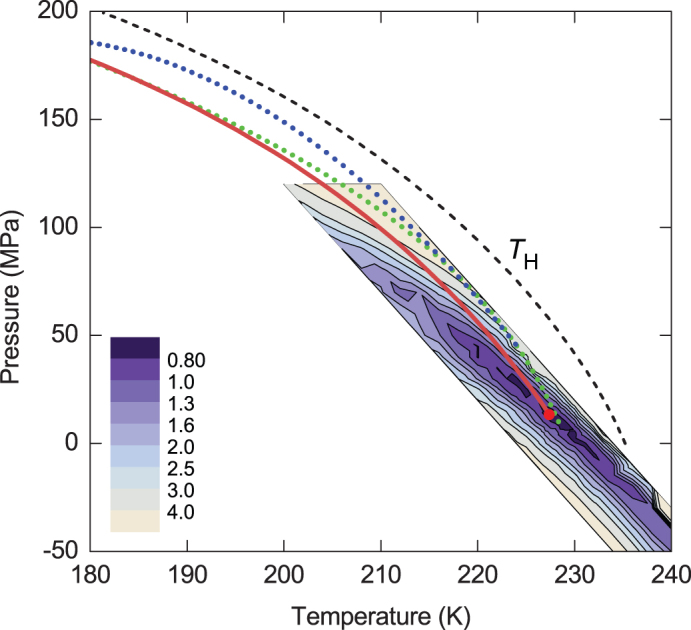
Figure 2. Optimization of the LLCP location.

The coloured map shows the reduced sum of squared residuals. The solid red line is the hypothesized LLT curve. The dashed curve shows the temperature of homogeneous ice nucleation19 TH. The blue dotted curve is the LLT suggestion by Mishima13 and the green dotted curve is the ‘singularity' line suggested by Kanno and Angell7.
