
Figure 5. Density along the liquid–liquid transition curve.
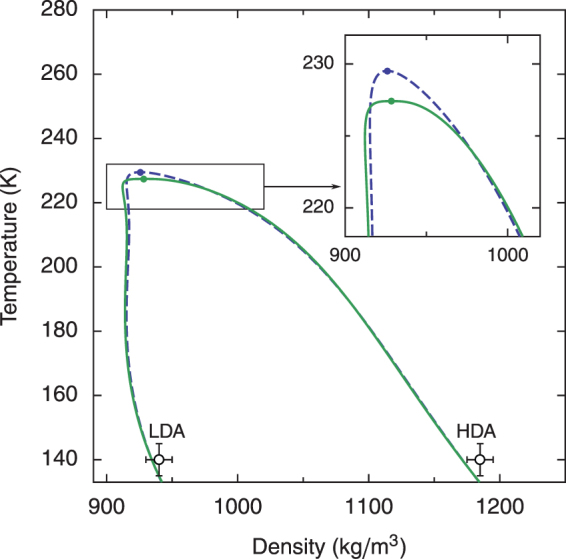
The dashed line represents the mean-field two-state model; the solid line represents the crossover two-state model. The open circles are the densities of the low-density amorphous (LDA) and high-density amorphous (HDA) phases of water at 200 MPa31. One can notice that the crossover LLT curve is flatter than the LLT curve in the mean-field approximation and that the actual position of the critical point is shifted to a lower temperature by critical fluctuations.