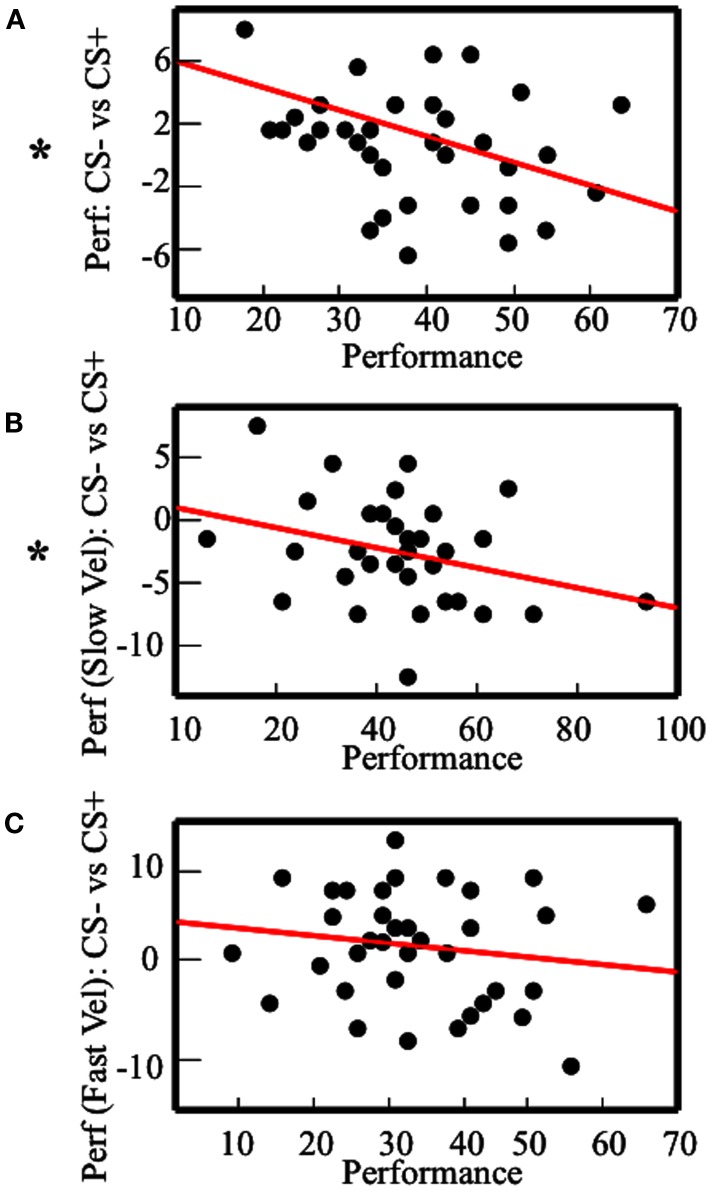
Figure 4.
Results of the between-subjects analysis. Correlation between the performance and the performance with CS− minus the performance with CS+. The plots describe the analysis with: (A) the average performance; (B) the performance with Slow Velocity; (C) the performance with Fast Velocity. Asterisks indicate significant Pearson-r.

