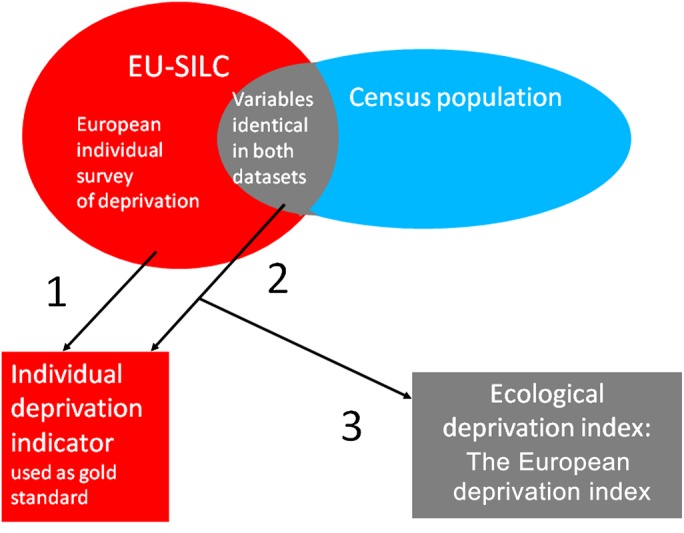
Figure 1.

Steps involved in constructing the European deprivation index (EDI). In red: individual data from the EU–SILC survey. In blue: ecological data from the census population. In grey: variables available both at an individual and ecological level; EDI is composed of ecological variables related to an individual deprivation indicator. EU–SILC, European Union–Statistics on Income and Living Conditions.
