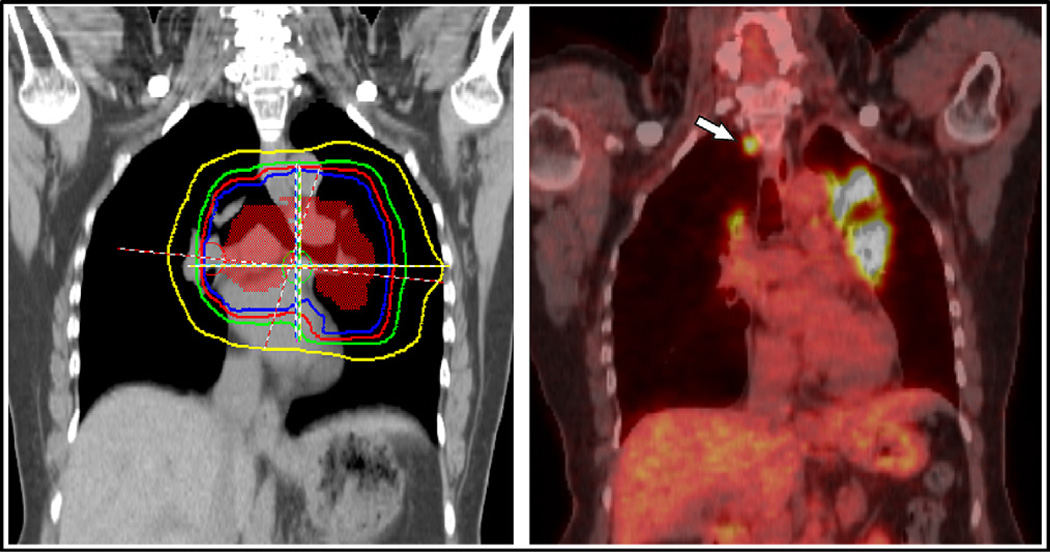
Fig. 3.
Example of isolated elective nodal failure in our cohort. (Right) Intensity-modulated radiotherapy planning dose volumes for this patient, who received 45 Gy in 30 fractions given twice daily (orange, clinical target volume; blue, 45 Gy isodose line; red, 36 Gy; green, 20 Gy; yellow, 5 Gy). (Left) Elective nodal failure in right paratracheal lymph node (white arrow) observed on surveillance positron emission tomography/computed tomography scan obtained about 3 months after radiotherapy completion. Other areas of 18F-fluorodeoxyglucose avidity on the image indicate inflammation and did not appear on subsequent scans.

