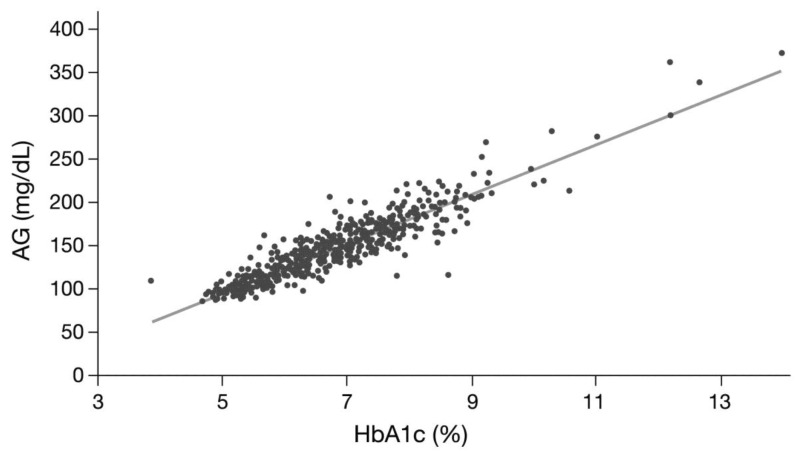
Figure 3.
The A1c-Derived Average Glucose (ADAG) Study Group demonstrated that HbA1c correlates well with average glucose (AG) (R2 = 0.84) 23, however, although 90% of HbA1c concentrations predicted the average measured glucose within ± 15%, significant deviations were observed. The regression equation is: Calculated AG (mg/dL) = 28.7 x HbA1c (%) - 46.7.

