
Figure 4.
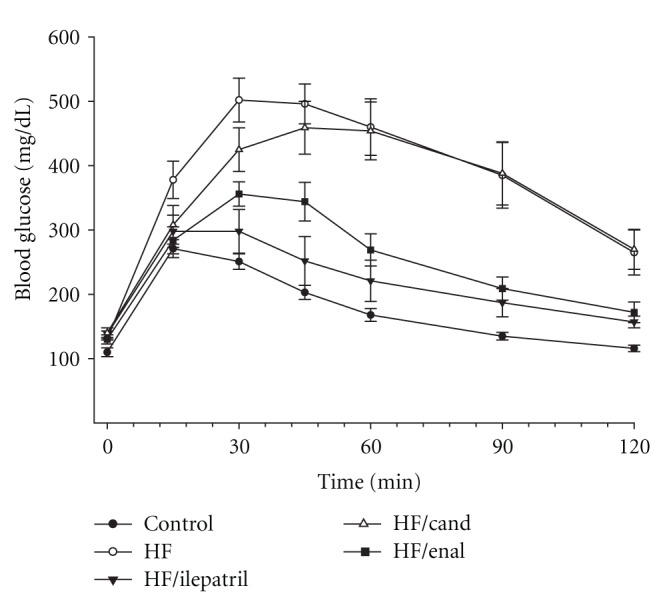
Plasma glucose concentration curve during intraperitoneal glucose tolerance test (IPGTT) for NEP−/− mice fed a normal or high-fat-containing diet for 24 weeks and the high-fat diet with or without ilepatril, candoxatril, or enalapril for the last 12 weeks (intervention protocol). Data are the mean ± SEM in mM. Fasting basal blood glucose levels were 110 ± 7, 131 ± 5, 138 ± 5, 140 ± 8, and 130 ± 7 mg/dL for control, high fat, high fat + ilepatril, high fat + candoxatril, and high fat + enalapril, respectively. Control (closed circles), high fat (open circles), high fat + ilepatril (closed innervated triangle), high fat + candoxatril (open triangle), and high fat + enalapril (closed rectangle). The area under the curve (AUC) was significantly different P < 0.01 for high-fat-fed mice versus control and high fat-fed-mice treated with candoxatril versus control. There was no significant difference for AUC between mice fed a high fat-diet containing ilepatril or enalapril versus control. The number of mice in each group was the same as shown in Table 2.