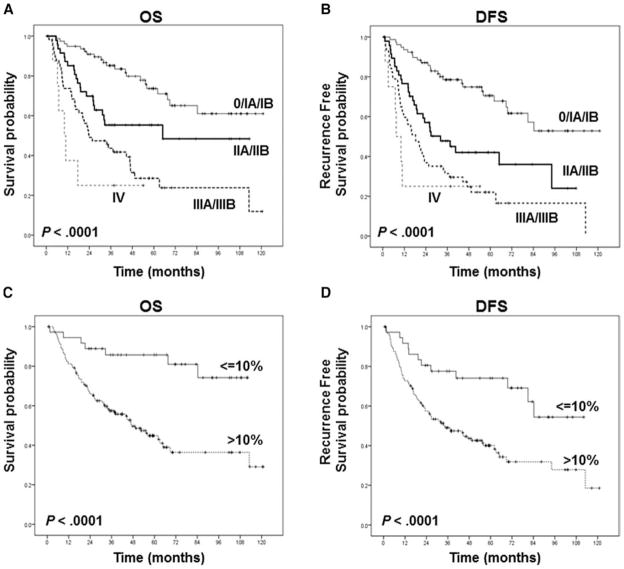
FIGURE 3.
Kaplan-Meier estimates of overall survival (A, C) and disease-free survival (B, D) based on pathologic stages (A, B) and percentage of viable tumor cells (C, D). A, The overall survival was significantly longer in patients with stages 0, IA, and IB than in patients with pathologic stage II, III, or IV. B, The disease-free survival was significantly longer in patients with stages 0, IA, and IB than in patients with pathologic stage II, III, or IV. C, The overall survival was significantly longer in patients with ≤10% viable tumor cells than in patients with >10% viable tumor cells. D, The disease-free survival was significantly longer in patients with ≤10% viable tumor cells than in patients with >10% viable tumor cells.

