
Figure 2.
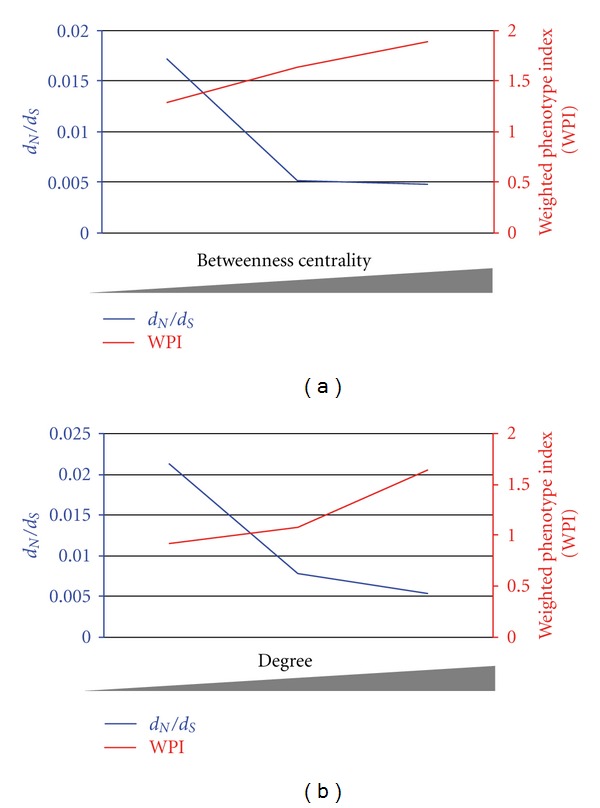
Plotting the relationship between divergence with measures of betweenness centrality or degree, and the relationship between contribution with measures of betweenness centrality or degree in a dynamic nematode odor network. (a) Divergence (left y-axis in blue) plotted against increasing measures of betweenness centrality (x-axis), and contribution (right y-axis in red) plotted against increasing measures of betweenness centrality. (b) Divergence (left y-axis in blue) plotted against increasing measures of degree (x-axis), and contribution (right y-axis in red) plotted against increasing measures of degree.